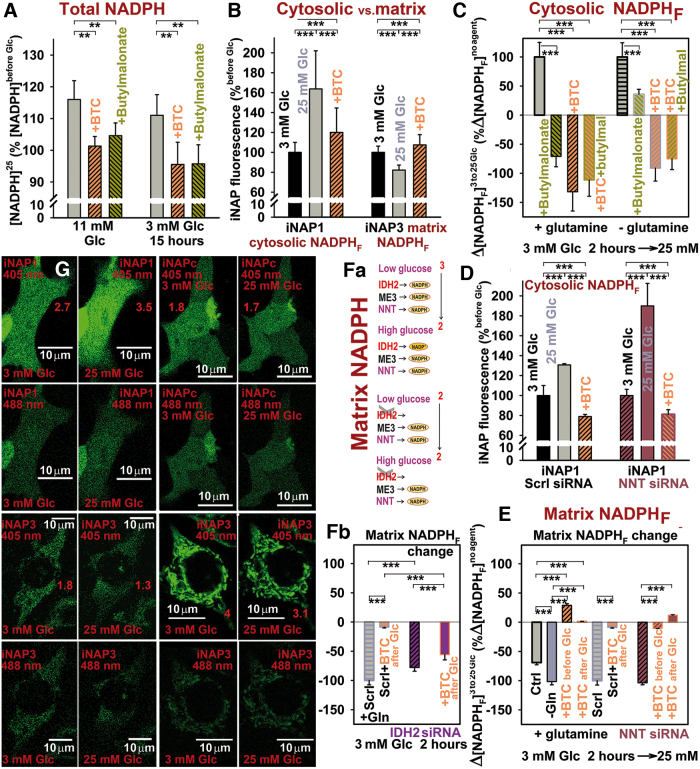
FIG. 5.
Cytosolic NADPH elevation on GSIS. (A) Total cell NADPH was assayed by the BioVision kit, ANOVA (n = 3–6) **p < 0.05; (B–D, G) cytosolic NADPH elevations, or (E–G) NADPH declines within the mitochondrial matrix, assayed by the iNAP1 or iNAP3 fluorescence probes, respectively, in INS-1E cells (preincubated with 3 mM glucose for 2 h) on glucose addition to the final concentration of 25 mM; in the absence or presence of CitC inhibitor (10 mM BTC, orange bars) or 2OGC inhibitor (5 mM n-butylmalonate, yellow-green bars) or both; or in NNT-silenced (brown bars, D, E) or IDH2-silenced cells (purple bars, Fb). Inhibitors were added after the glucose addition (B–D). Images in (G) show representative cells transfected with iNAP1 and iNAP3, respectively, or nonresponding iNAPc observed by confocal microscopy at 405 and 488 nm excitations. Emission ratios 405/488 are indicated by numbers. (Fa) The most probable enzyme contribution to the mitochondrial matrix NADPH pool, under the assumption that NNT always acts in its forward mode (combinations of all NNT possible modes see Supplementary Fig. S2Ef) and of equal enzyme contribution to the NADPH pool. It is deduced that IDH2 deletion should lead to a large elimination of the matrix NADPHF drop on GSIS. This trend was observed only for IDH2-silenced cells with BTC. ANOVA for (B, C) n = 40–60 image spots or (Fb, B) n = 35–55; n = 85 for controls: ***p < 0.001. Color images are available online.

