FIG. 8.
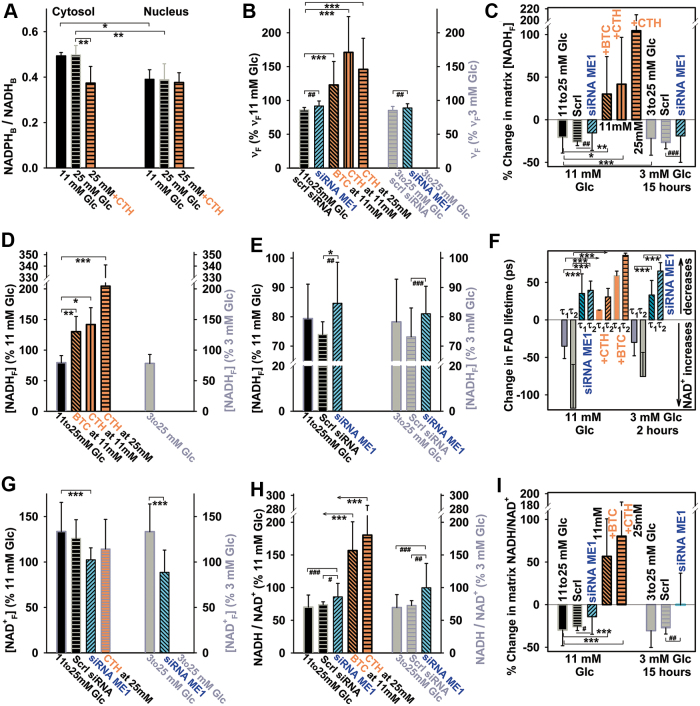
2chFLIM-derived changes in mitochondrial matrix NADH, NAD+, and NADH/NAD+ ratio compared with cytosolic bound NADPH/NADH ratios on GSIS. (A) Cytosolic and nuclear-bound NADPH/NADH ratios derived from 2chFLIM according to Blacker et al. (6) in extramitochondrial ROI and nuclear ROI is shown for INS-1E cells. (B–I) Relative changes in mitochondrial matrix on glucose elevation to 25 mM for coefficient νF as calculated by using eq. {11} (B); estimated free NADH (unbound; NADHF) (C–E); free NAD+ (derived from 2chFLIM on the basis of FAD signal quenching by NAD+, using eq. {13}); and approximated changes in substrate pressure S—where S = NADHF/NAD+F and changes are expressed as S(2)/S(1) in percentages, where S(1) denotes the substrate pressure before and S(2) after GSIS for free compounds, using eq. {15}. BTC, 10 mM, CTH, 0.5 mM. Data were calculated by using the integral parameters from the mitochondrial network ROI (except for A) and expressed as averages ± SD of analyzed N biological replicates (2chFLIM NAD(P)H autofluorescence images), each typically containing 80–100 cells, while having n estimations in each. ANOVA: ***p < 0.001; **p < 0.05; *p < 0.1; Student's t-test: ###p < 0.001; ##p < 0.01; #p < 0.1. N/n for INS-1E cells preincubated with 11 mM glucose was 13/31 (7/17 siRNA ME1; 7/21 with CTH; 3/9 with BTC); whereas with 3 mM glucose N/n was 16/41 (6/16 siRNA ME1). CTH, 4-chloro-3-[[(3-nitrophenyl) amino] sulfonyl]-benzoic acid. Color images are available online.

