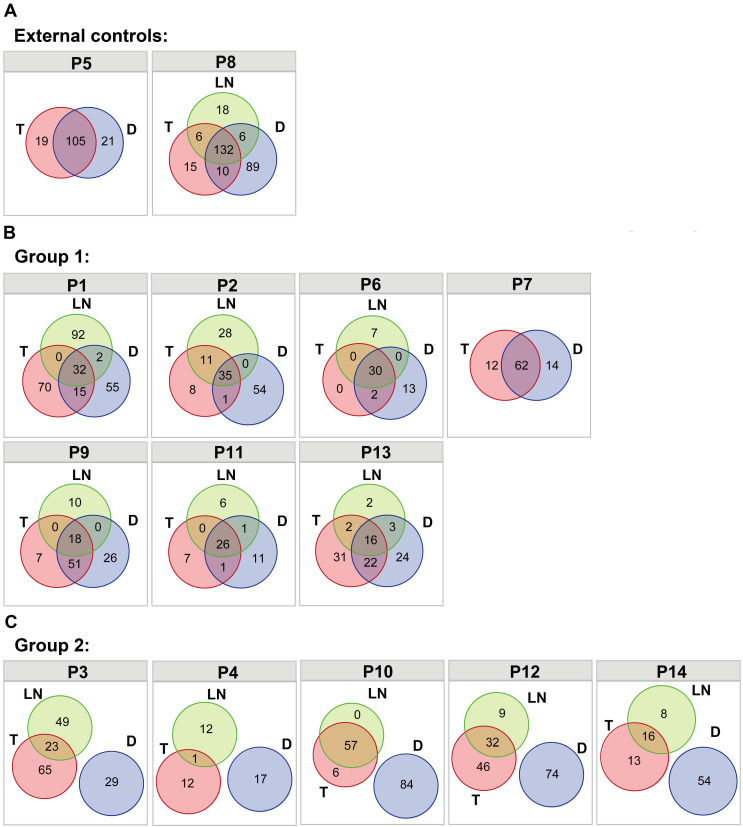
Figure 1.
The distribution of nonsynonymous somatic mutations among different tumors. (A) Venn diagrams showing the distribution of nonsynonymous somatic mutations among different tumors within the same patient in P5 and P8 (external controls). (B) Venn diagrams showing the distribution of nonsynonymous somatic mutations among different tumors within the same patient in P1, P2, P6, P7, P9, P11 and P13 (group 1). (C) Venn diagrams showing the distribution of nonsynonymous somatic mutations among different tumors within the same patient in P3, P4, P10, P12 and P14 (group 2).

