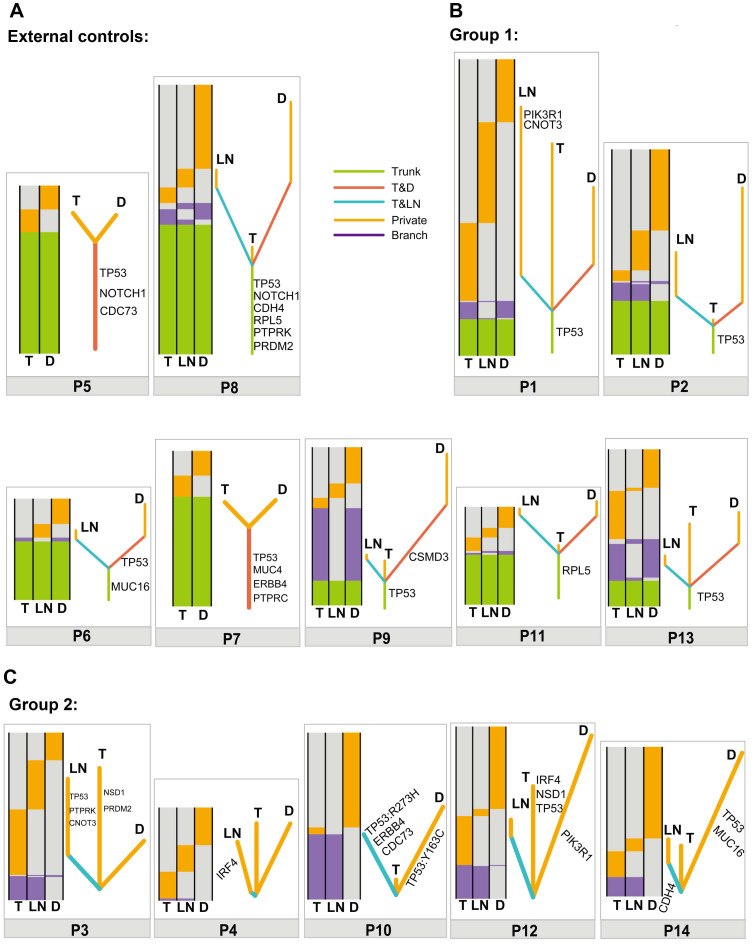
Figure 2.
Relationship of different tumors from one patient based on somatic mutated genes. (A) Heatmaps (left) and phylogenetic trees (right) showing the relationship of different tumors from one patient based on somatic mutated genes in P5 and P8 (external controls). (B) Heatmaps (left) and phylogenetic trees (right) showing the relationship of different tumors from one patient based on somatic mutated genes in P1, P2, P6, P7, P9, P11 and P13 (group 1). (C) Heatmaps (left) and phylogenetic trees (right) showing the relationship of different tumors from one patient based on somatic mutated genes in P3, P4, P10, P12 and P14 (group 2). Trunk, branch and private mutations are illustrated in the heatmaps.

