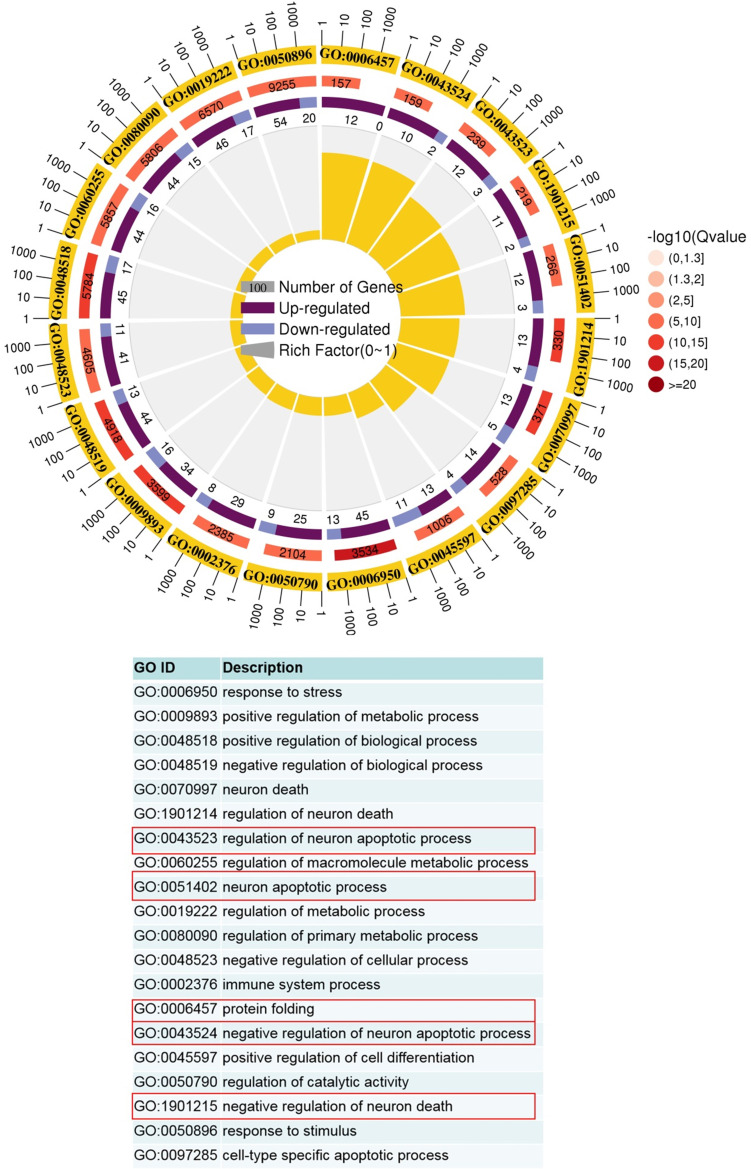
Figure 6.
GO term analysis of upregulated pathways in Vsir-/- versus WT macrophages was performed. The first lap indicates top 20 GO term and the number of the genes corresponds to the outer lap. The second lap indicates the number of the genes in the genome background and Q values for enrichment of the upregulated genes for the specified biological process. The third lap indicates the ratio of the upregulated genes (deep purple) and downregulated genes (light purple). The fourth lap indicates the enrichment factor of each GO term. GO, gene ontology.

