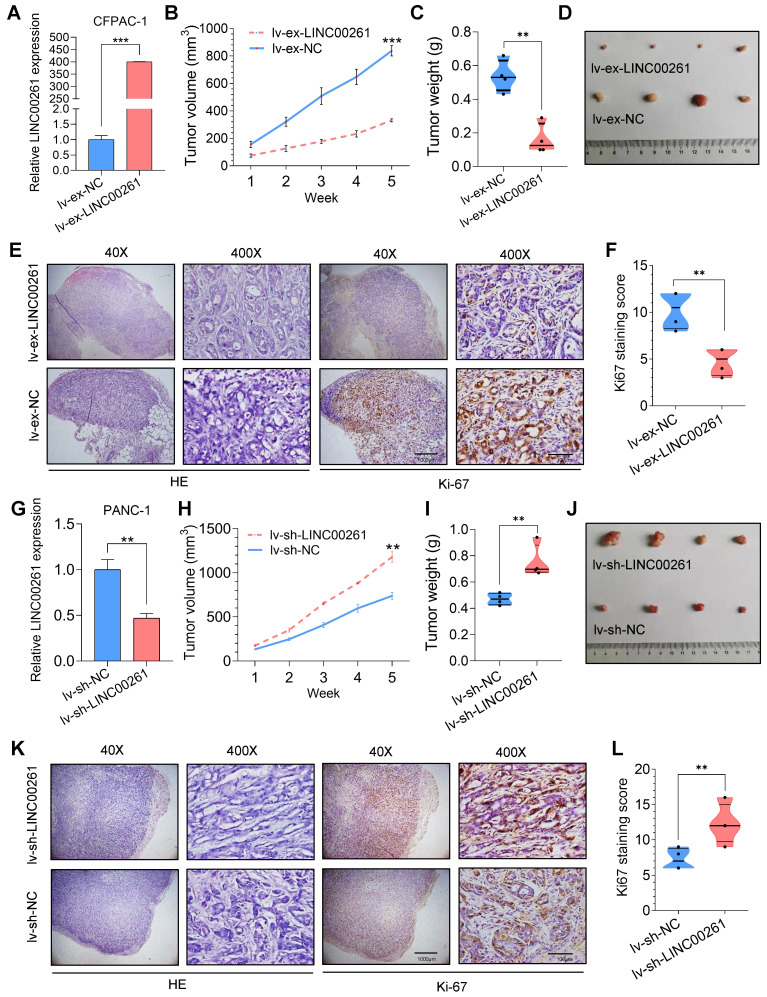
Figure 3.
LINC00261 influences tumor growth in vivo. (A) qRT-PCR analysis was performed on LINC00261-overexpressing CFPAC-1 cells using a lentiviral system. (B) LINC00261 overexpression inhibited PC cell proliferation in vivo. CFPAC-1 cells with stable expression of LINC00261 and control cells were subcutaneously injected into 4- to 6-week-old female nude mice. The chart shows the tumor volume as measured each week in the control and LINC00261 overexpression groups. (C) Histogram indicating the mean tumor weights 5 weeks after inoculation in the control and LINC00261 overexpression groups. (D) Images of tumor lesions in the control and LINC00261 overexpression groups. (E) Representative images of hematoxylin and eosin (HE) staining and Ki67 immunostaining of tumor samples from mice in different groups. (F) The Ki67 staining score was assessed in the control and LINC00261 overexpression groups. (G) qRT-PCR analysis was performed on LINC00261 knockdown PANC-1 cells using a lentiviral system. (H) Knockdown of LINC00261 promoted PC cell proliferation in vivo. Chart showing the tumor volume as measured each week in the control and LINC00261 knockdown groups. (I) Histogram indicating the mean tumor weights 5 weeks after inoculation in the control and LINC00261 knockdown groups. (J) Images of tumor lesions in the control and LINC00261 knockdown groups. (K) Representative images of HE staining and Ki67 immunostaining of tumor samples from mice in different groups. (L) Ki67 staining score in the control and LINC00261 knockdown groups (scale bars, 1000 µm and 100 µm). (*P < 0.05, **P < 0.01, ***P < 0.001).

