Figure 5.
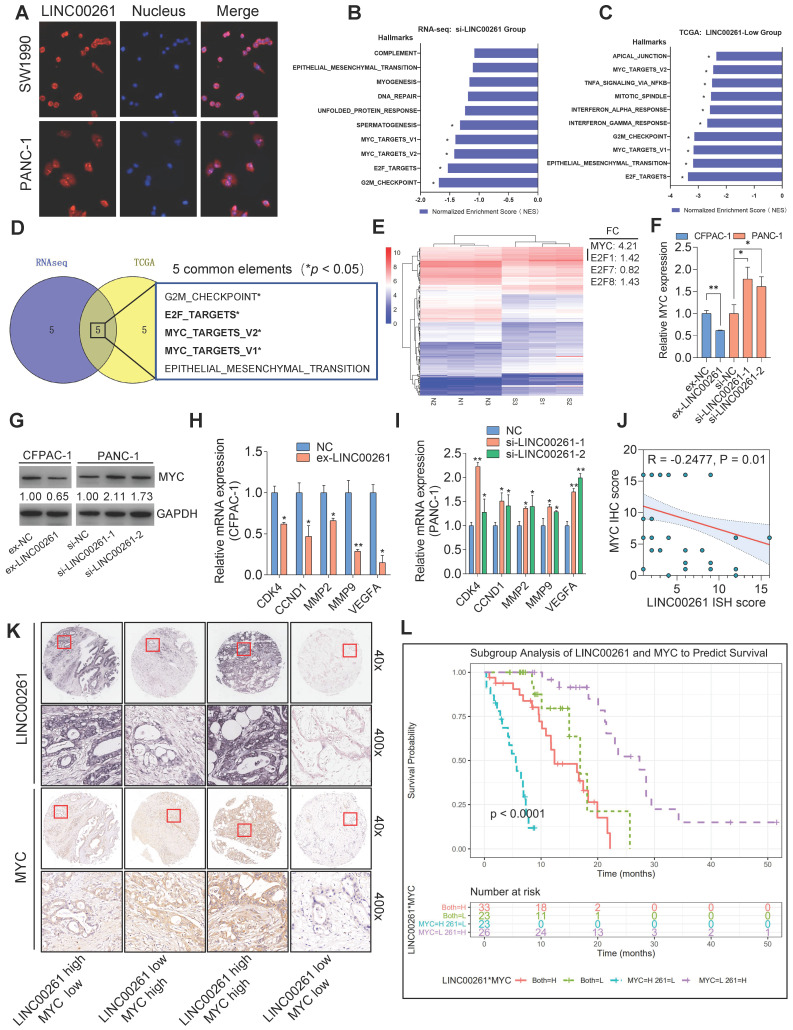
c-Myc is a critical downstream target of LINC00261. (A) FISH analysis showing the subcellular localization of LINC00261 in PANC-1 and SW1990 cells. (B and C) The top 10 enriched pathways in cells with LINC00261 silencing and patients with low LINC00261 expression identified by GSEA focused on a set of hallmark signaling pathways. Data are summarized based on the normalized enrichment score (NES). (D) Venn diagram of common enrichment pathways between the two groups (*NOM P-value <0.05). (E) Heatmap of differentially expressed downstream genes in LINC00261 knockdown PANC-1 cells (S1-3) and the corresponding control cells (N1-3) (P<0.05). (F) c-Myc gene expression levels, as analyzed by qPCR, in the LINC00261 knockdown group and the LINC00261 overexpression group. (G) c-Myc protein expression levels, as analyzed by WB, in the LINC00261 knockdown group and the LINC00261 overexpression group. (H) Expression levels of c-Myc-related downstream genes, as analyzed by qPCR, in LINC00261-overexpressing CFPAC-1 cells and control cells. (I) Expression levels of c-Myc-related downstream genes, as analyzed by qPCR, in LINC00261-knockdown PANC-1 cells and control cells. (J) Spearman correlation analysis of the association between LINC00261 and c-Myc. Fisher's test was performed in parallel (P=0.002, MYC and LINC00261 expressions were dichotomized using the median value). (K) Representative images of different staining intensities of ISH or IHC staining for LINC00261 and c-Myc in tissues (high: high expression; low: low expression). (L) Kaplan-Meier survival analysis of the four groups of PC patients stratified based on LINC00261 ISH data and c-Myc IHC data (*P < 0.05, **P < 0.01, ***P < 0.001).

