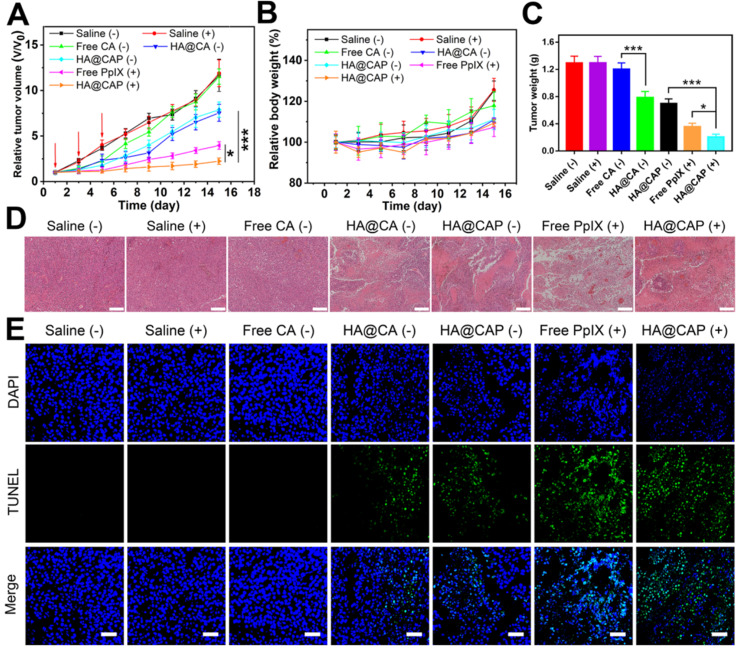
Figure 9.
The in vivo antitumor performance of HA@CAP on the B16F10 tumor-bearing mice. Relative tumor volume growth curves (A) and body weight changes (B) of tumor-bearing mice after different treatments. (Red arrows indicated the time points of treatments). (C) Mean weight of excised tumor in various groups at the end of treatment. (D) H&E and (E) TUNEL staining of the tumor sections at the end of treatment. Scale bar: 200 µm (H&E); 50 µm (TUNEL). Data are represented as the mean ± SD (n = 5). *p < 0.05, **p < 0.01, and ***p < 0.001.

