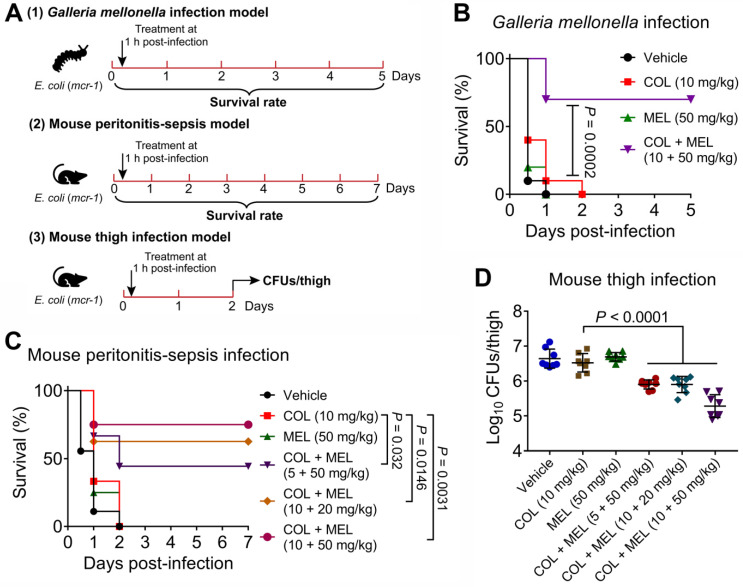
Figure 7.
Melatonin rescues colistin activity in three animal infection models. (A) Scheme of the experimental protocols for three animal infection models. In three infection models, animals were infected by colistin-resistant E. coli B2 (mcr-1), and treated with a single dose of colistin, melatonin or their combination at one-hour post-infection. In the Galleria mellonella infection model (1), survival rate of larvae (n = 10 per group) was monitored during 5 days, related to Figure 7B. In the mouse peritonitis-sepsis infection model (2), the percentage of surviving mice (n = 8 or 9 per group) was recorded during 7 days, related to Figure 7C. In neutropenic mouse thigh infection model (3), thigh muscle bacterial loads in single and combination therapy (n = 8 per group) were counted at 2 days post-infection, related to Figure 7D. (B) Combination of colistin (10 mg/kg) and melatonin (50 mg/kg) significantly improved survival rate of G. mellonella larvae (n = 10 per group) infected by colistin-resistant E. coli (mcr-1) compared with colistin monotherapy (10 mg/kg). P values were determined by log-rank (Mantel-Cox) test. (C) Combination of colistin and melatonin profoundly increased survival rate of mice infected by colistin-resistant E. coli (mcr-1) during 7 days post-infection in a dose-dependent manner. BALB/c mice (n = 8 or 9 per group) were given a lethal dose of E. coli (3.0 × 10⁸ CFUs), and treated with a single dose of colistin (10 mg/kg), melatonin (50 mg/kg), a combination of colistin plus melatonin (5 + 50 mg/kg, 10 + 20 mg/kg and 10 + 50 mg/kg), or PBS by intraperitoneal injection. P values were determined by log-rank (Mantel-Cox) test. (D) Decreased bacterial load in the neutropenic mouse thigh infection model by combination therapy. Neutropenic BALB/c mice (n = 8 per group) were intramuscularly given a non-lethal dose of E. coli (1.0 × 10⁵ CFUs), and treated with a single dose of colistin (10 mg/kg), melatonin (50 mg/kg), a combination of colistin plus melatonin (5 + 50 mg/kg, 10 + 20 mg/kg and 10 + 50 mg/kg), or PBS by intraperitoneal injection. P values were determined by Mann-Whitney U test. Data are presented as mean ± SD.

