Figure 3.
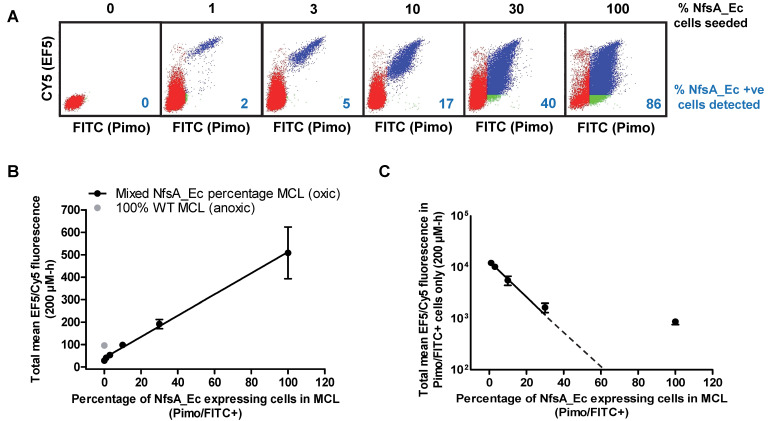
Evaluation of NfsA_Ec dependent EF5 metabolism at high cell density. A) Representative dot plots from each mixed NfsA_Ec MCL treated with 200 µmol-hr EF5. B) Total EF5/CY5 fluorescence in MCLs with varying densities of nfsA-expressing cells under oxic conditions compared to 100% HCT116 WT MCLs in anoxic conditions, R2 = 0.99. Values are mean ±SEM of 3 independent experiments. C) Level of EF5/CY5 expression in pimonidazole positive (NfsA_Ec) cells only, R2 = 0.80 (all data points) and R2 = 0.99 (all but data point for 100% NfsA_Ec MCL). Values are mean ±SEM of 3 independent experiments.

