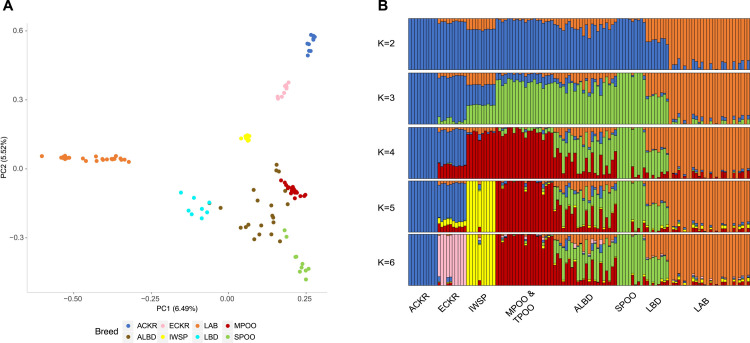
Fig 2. PCA and Admixture analyses.
A) PCA analysis plot of the top two principal components (PC1 and PC2), showing the distribution of the eight breeds of interest accounting for a genetic variance of 6.5% and 5.5%, respectively. (B). Admixture analysis representing data for K = 2–6 cluster-based ancestry models. Each bar represents an individual dog, and the color length for each bar represents the proportion of genomic contribution from the founder population.

