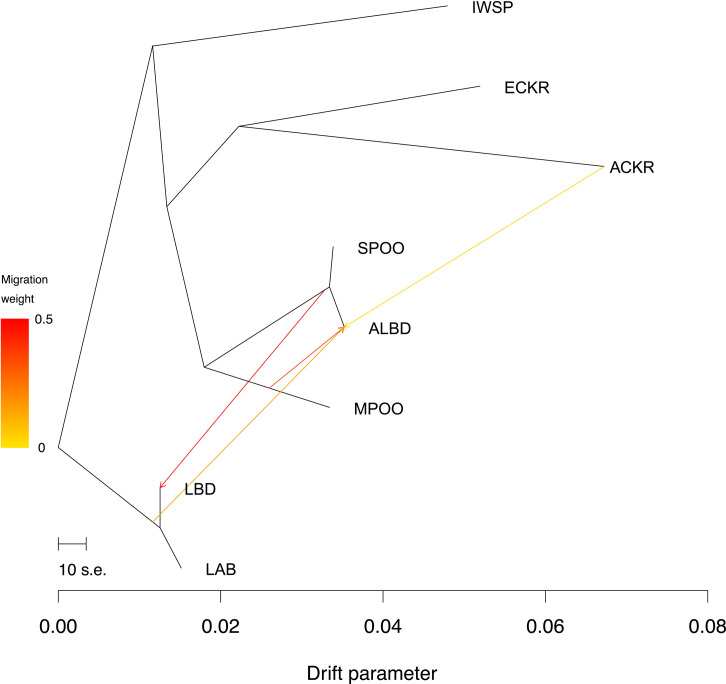
Fig 5. Maximum likelihood tree.
Tree was constructed with TreeMix using four migration events, LD, and a bootstrapped over 1,000 bp windows. Breed abbreviations correspond to S2 Table. X-axis indicates the amount of genetic drift. The arrows denote migration from origin to recipient breed, and the weight of migration is scaled according to percentage mixture indicated by the heat map on the y-axis.

