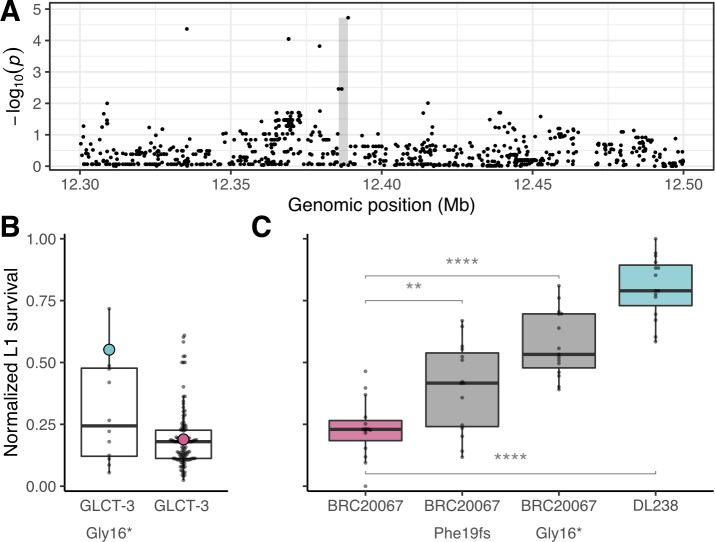
Fig 4. Variation in glct-3 underlies differential propionate sensitivity in C. elegans.
(A) Manhattan plot showing the strength of correlation between variants surrounding the glct-3 gene identified by gene-based GWA mapping of the normalized L1 survival after propionate exposure phenotype. The gray shaded rectangle represents the glct-3 gene (chrI:12385765–12388791). (B) Tukey box plots of C. elegans wild isolate’s normalized L1 survival after exposure to 100 mM propionate. Each dot represents the mean of 20 replicate measures for each strain. Strains are separated by the presence of a stop-gained variant at amino acid position 16 of GLCT-3. DL238 (blue) and BRC20067 (pink) are highlighted for reference. (C) Tukey box plots of normalized L1 survival of each CRISPR-edited and parental strain after exposure to 100 mM propionate are shown. Each dot represents a replicate L1 survival measurement. (The effect of strain on phenotype data is significant from analysis of variance [F(3,56) = 45.081, p < 0.05E-10]. For individual strain comparisons: ** represents [F(1,28) = 9.28, p = 0.005] and **** for the BRC20067 –BRC20067 (Gly16*) comparison [F(1,28) = 55.25992, p < 0.05E-6]) And for the BRC20067 –DL238 comparison [F(1,28) = 165.7699, p < 0.05E-6]).

