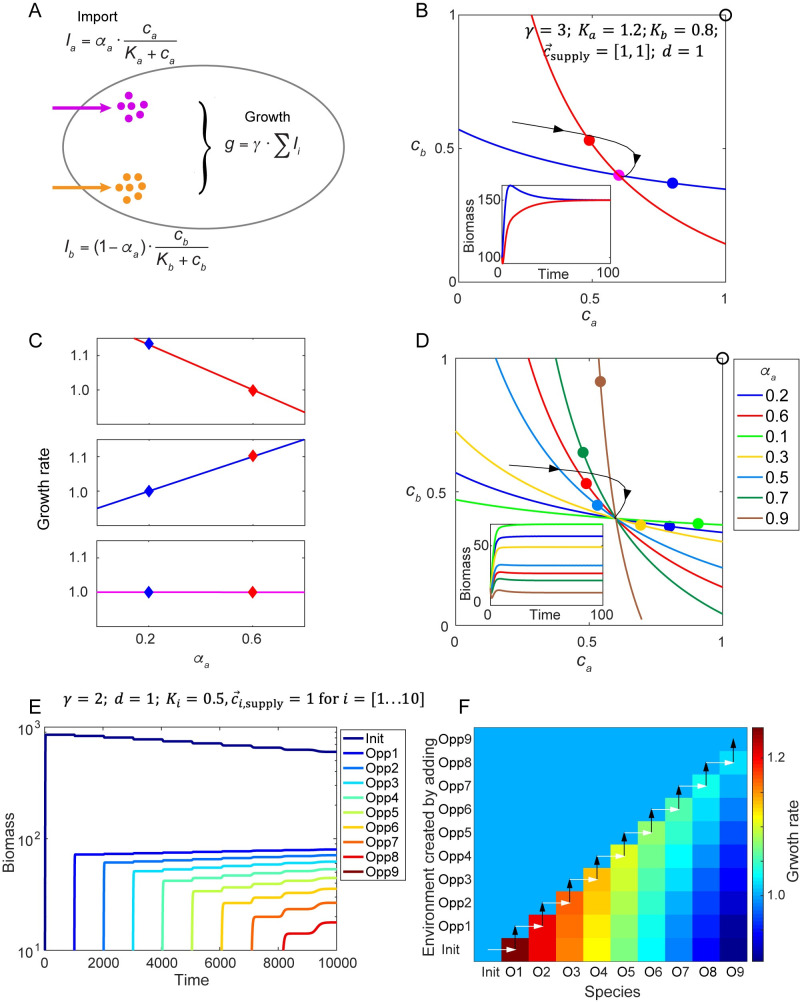
Fig 2. Metabolic models with substitutable nutrients can achieve a flat fitness landscape.
A. Example of a metabolic model with a trade-off in allocation of internal resources for import of two substitutable nutrients, with both nutrients contributing additively to growth. Species Red and species Blue allocate resources differently (indicated by parameter αa, see S1 Appendix). B. Growth contours and the steady-state environments created by Red or Blue alone, under the supply condition shown by the black circle. Black curve with arrows shows a trajectory in chemical space. Purple dot indicates the steady-state environment created by Red and Blue together. Lower inset: time course of species biomass. C. From upper panel to bottom panel: the fitness landscape created by Red alone (for the red dot in (B)), created by Blue alone (for the blue dot in (B)), and created by both species (for the purple dot in (B)). Diamonds mark the locations of Red and Blue strategies and their corresponding fitness in each fitness landscape. D. Growth contours and the species-specific steady-state environments for seven different species alone, under the supply condition shown by the black circle. Black curve with arrows shows a trajectory in chemical space. Lower inset: time course of species biomass in the chemostat. E. Population dynamics in a 10-dimensional chemical space. The chemostat is initially occupied by a species (Init) that has an arbitrarily assigned enzyme allocation strategy. Then, in the steady-state environment created by Init, the “opportunist” species (Opp 1) with the maximal growth rate in that environment is added to the chemostat. Subsequently, further opportunist species (Opp 2–9) are added sequentially to the steady states created by the existing consortia of species, until there is no further opportunist strategy with a growth rate higher than the dilution rate. F. The instantaneous growth rates of the 10 strategies from (E) under the steady-state environments created after adding each species to the existing consortium. Each white arrow indicates the addition of the new species with the fastest growth rate in that environment; black arrows indicate the change of the steady-state chemical environment caused by adding these new species.

