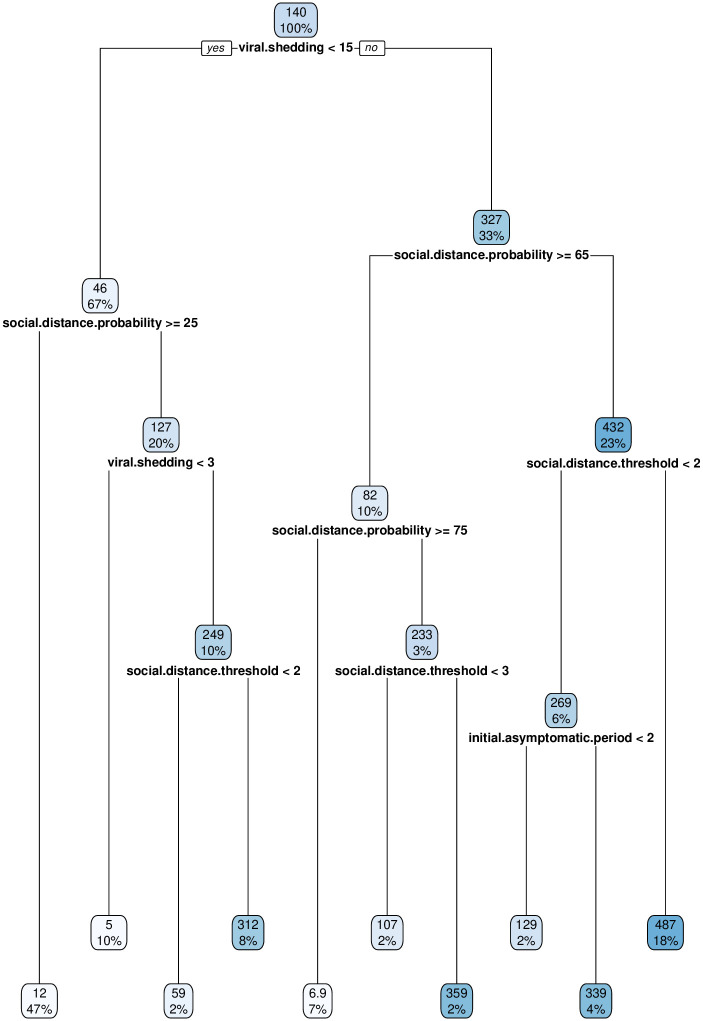
Fig 2. Regression tree for total number of infections.
This tree identifies the input features with strongest influence on total number of infections. Each box contains the percentage of observations and associated mean viral load of agents. For example, in the upper-left box, 67% of the simulations had viral shedding below 15%, and for those simulations the mean number of infections was 46.

