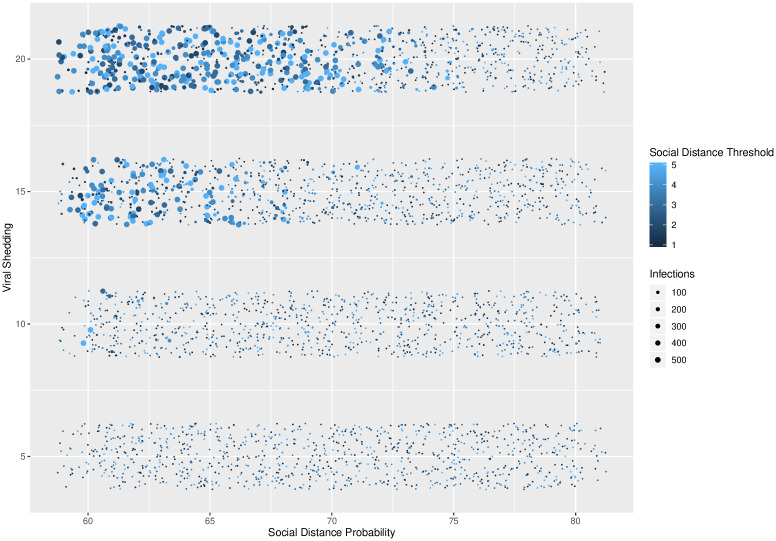
Fig 6. Total infections across social distance probability and viral shedding.
Social distance probability vs. viral shedding, with social distance threshold and total number of infections indicated by color and size. Larger numbers of infections occur with low social distance probability and high viral shedding rates.

