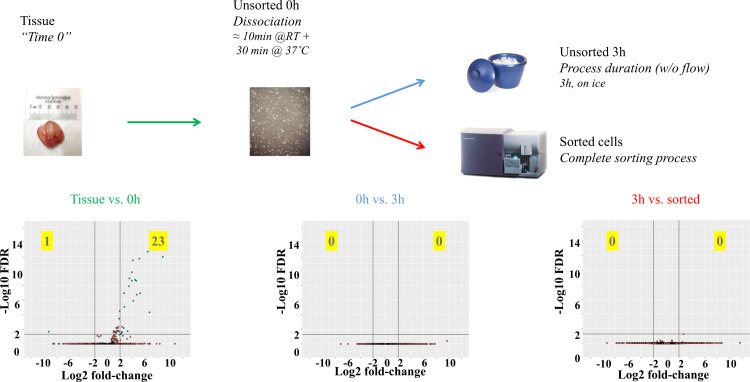
Fig 2. Pairwise comparisons between gene expression profiles generated through bulk RNASeq for 4 different conditions.
0h time point represents cells immediately after dissociation; 3h time point represents cells left undisturbed for 3 hours after dissociation while sorted cells underwent flow sorting which generally took up to 3 hours. Volcano plots show the log2 fold-change (x-axis) and the statistical significance as–log(FDR) (y-axis). Lines indicate the cutoff values chosen (4-fold and FDR<0.05). FDR values were calculated across the entire data set.

