
Figure 1.
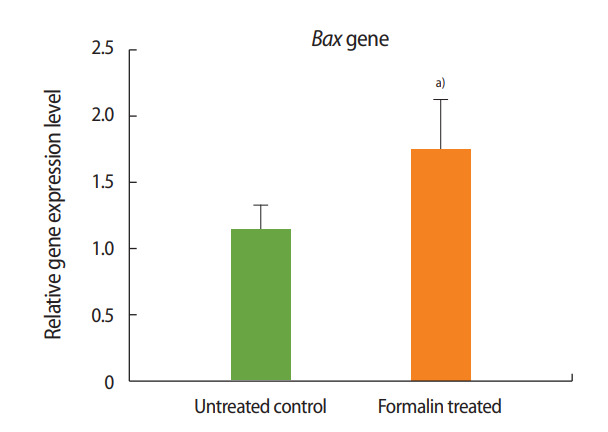
Relative expression of Bax in the formalin-treated group compared to the control group. a)p< 0.01.
Official websites use .gov
A
.gov website belongs to an official
government organization in the United States.
Secure .gov websites use HTTPS
A lock (
) or https:// means you've safely
connected to the .gov website. Share sensitive
information only on official, secure websites.
Relative expression of Bax in the formalin-treated group compared to the control group. a)p< 0.01.