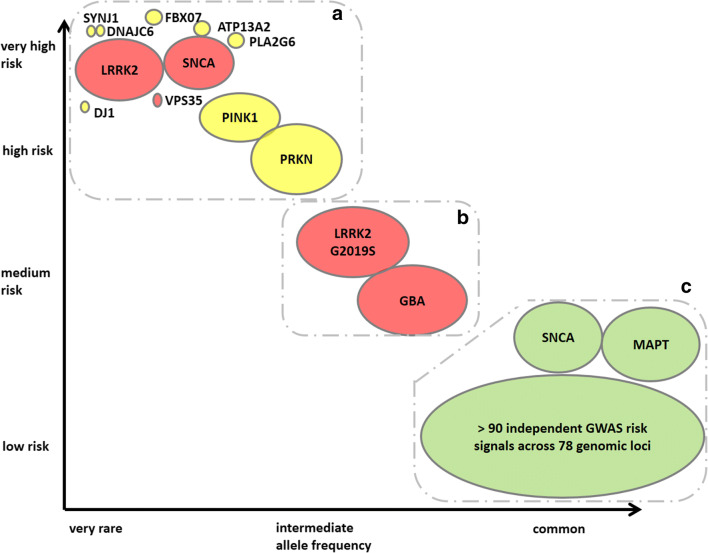
Fig. 1.
Genetic architecture of Parkinson’s disease, modified from [4] and [5], showing the continuum of variants of different effect strengths and allele frequencies. The size of the bubbles roughly corresponds to population allele frequencies. Colors symbolize modes of inheritance: dominant (red), recessive (yellow), risk loci (green). The genetic risks for PD can be roughly divided into three groups (dotted areas; see main text for more details). The group of common low-risk genes (lower right corner) includes more than 90 putative independent genome-wide significant signals identified in a GWAS meta-analysis based on more than 13,000 patients and 95,000 controls [6]. Similar to LRRK2 and SNCA, some mutations in VPS13C and GCH1 are likely causal or confer high risk for PD [6]

