Figure 2.
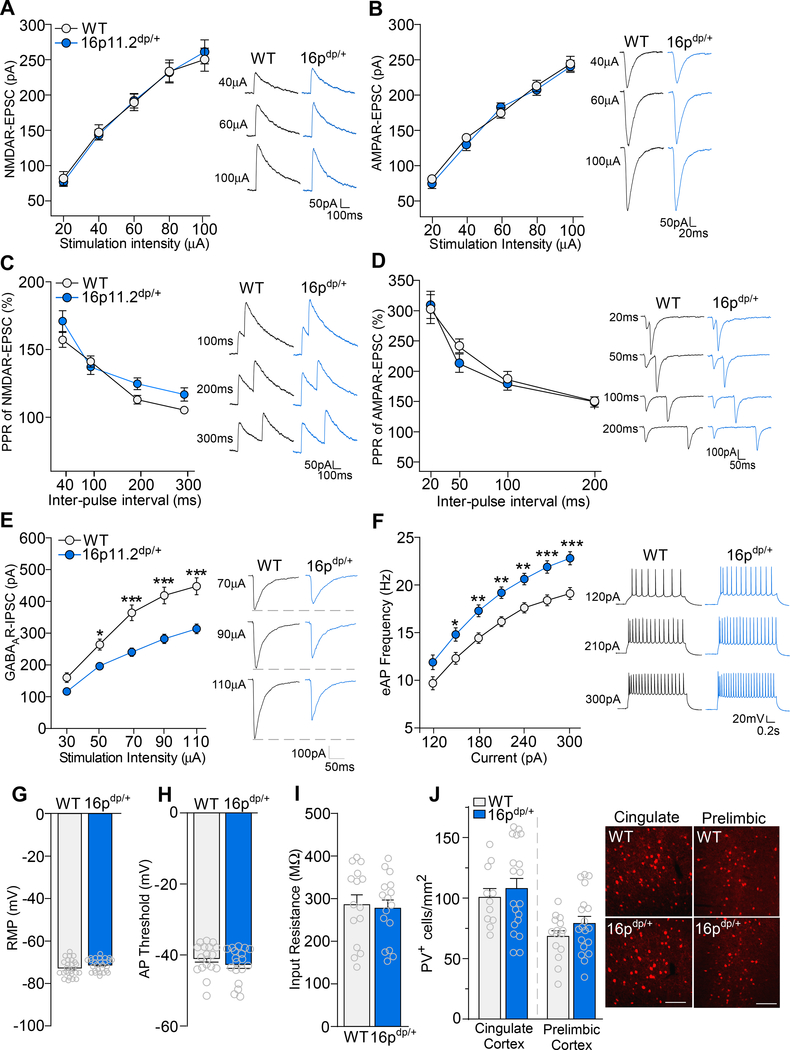
16p11.2dp/+ mPFC pyramidal neurons exhibit GABAergic synaptic deficits and elevated excitability. A, B, Summarized input-output curves of NMDAR-EPSC (A) and AMPAR-EPSC (B) in WT and 16p11.2dp/+ PFC neurons. Inset: representative NMDAR-EPSC and AMPAR-EPSC traces. NMDA: n = 14–17 cells, 3–4 mice/group; AMPA: n = 12–15 cells, 3 mice/group. C, D, Plot of paired-pulse ratio (PPR) of NMDAR-EPSC (C) and AMPAR-EPSC (D) evoked by double-pulses with various intervals in PFC pyramidal neurons from WT and 16p11.2dp/+ mice. Inset: representative traces. NMDA: n = 16–24 cells, 3–5 mice/group; AMPA: n = 8 cells, 2 mice/group. E, Summarized input-output curves of GABAAR-IPSC in WT and 16p11.2dp/+ mPFC pyramidal neurons. Inset: representative GABAR-IPSC traces. n = 28–31 cells, 7–8 mice/group. F, Plot of AP firing frequencies evoked by different depolarizing current injections in WT and 16p11.2dp/+ PFC neurons. Inset: representative eAP firing traces. n = 26–27 cells, 4 mice/group. G, Bar graph showing resting membrane potential (RMP) in PFC pyramidal neurons from WT and 16p11.2dp/+ mice. n = 26–27 cells, 4 mice/group. H, Bar graph showing action potential (AP) threshold in PFC pyramidal neurons from WT and 16p11.2dp/+ mice. n = 18 cells, 4 mice/group. I, Bar graph showing input resistance in PFC pyramidal neurons from WT and 16p11.2dp/+ mice. n = 15–16 cells, 4 mice/group. J, Bar graph showing the number of Parvalbumin expressing (PV+) cells in the cingulate cortex and prelimbic cortex of WT and 16p11.2dp/+ mice. Inset: representative immunostaining images; scale bars = 200 μM. Cingulate cortex: n = 11–19 slices, 4 mice/group; Prelimbic cortex: n = 15–19 slices, 4 mice/group. All data are presented as mean ± SEM. In all figures, * p < 0.05; ** p < 0.01; *** p < 0.0001.

