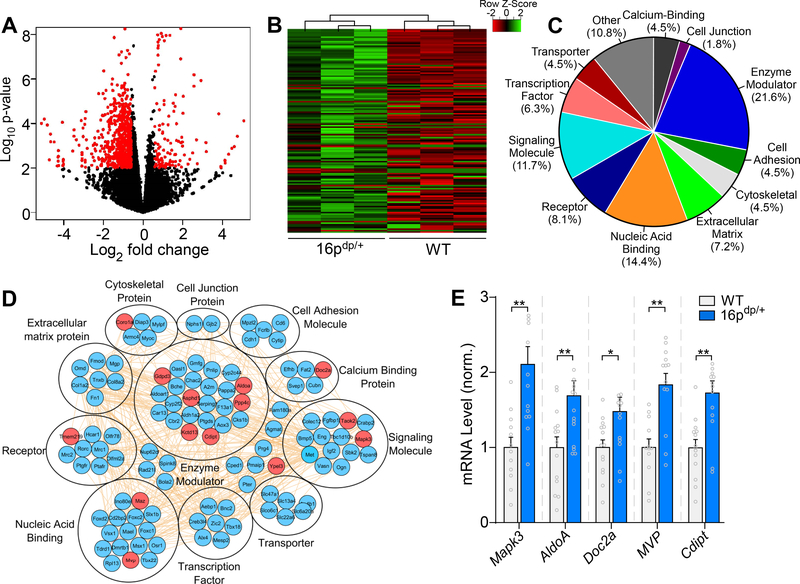
Figure 3.
RNA-sequencing identifies numerous upregulated genes in PFC of 16p11.2dp/+ mice. A, Volcano plot illustrating gene distributions based on expression levels in 16p11.2dp/+ mice relative to WT animals; black dots represent genes not significantly altered, red dots represent differentially expressed genes in 16p11.2dp/+ (>1.5-fold change, p < 0.05, FDR < 0.3). B, Heat map representing expression (row z-score) of 111 significantly upregulated genes in PFC from 16p11.2dp/+ mice relative to WT values. C, Pie chart displaying the biological function classification of the upregulated genes in 16p11.2dp/+ PFC based on Gene Ontology. D, Interactome network showing predicted interactions between the upregulated genes in various ontological classifications. Genes located within the duplicated 16p11.2 chromosomal region are designated in red. E, Bar graph comparing mRNA level of five upregulated genes located in the 16p11.2 region between WT and 16p11.2dp/+ PFC. n = 12–15 mice/group. All data are presented as mean ± SEM. In all figures, * p < 0.05; ** p < 0.01.

