Figure 4.
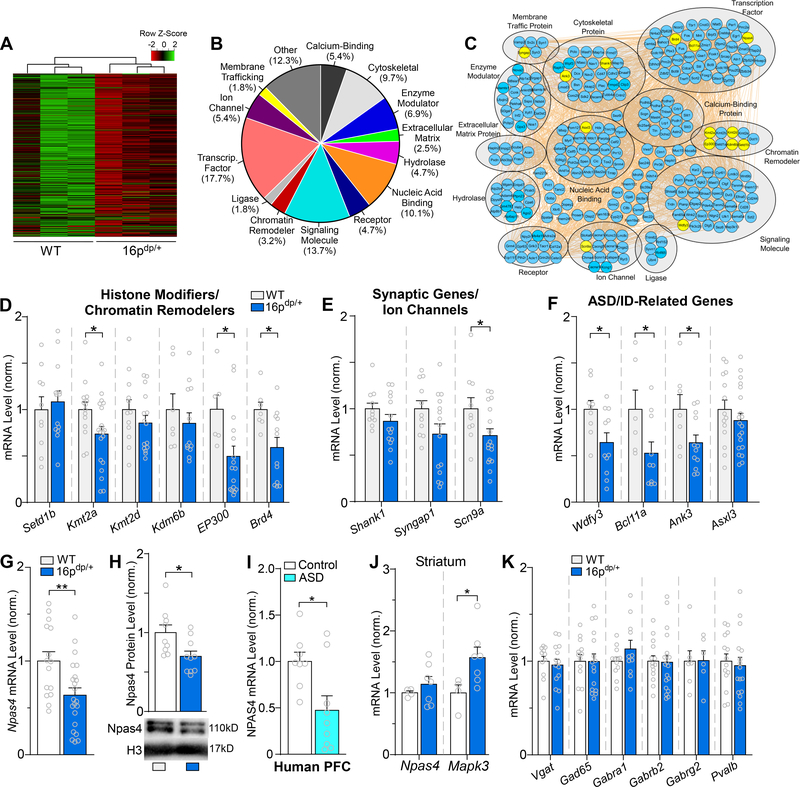
RNA-sequencing identifies downregulated genes from diverse classes in 16p11.2dp/+ PFC, including the GABA-synapse regulator Npas4. A, Heat map representing expression (row z-score) of 277 significantly downregulated genes in PFC from 16p11.2dp/+ mice relative to WT values. B, Pie chart displaying the biological function classification of the downregulated genes in 16p11.2dp/+ PFC based on Gene Ontology. C, Interactome network showing predicted interactions between the downregulated genes in various ontological classifications. Genes assessed via qPCR are designated in yellow. D, Bar graph comparing WT and 16p11.2dp/+ PFC mRNA expression level for several genes encoding chromatin remodelers identified as significantly downregulated via RNA-seq. n = 7–20 mice/group. E, Bar graph comparing WT and 16p11.2dp/+ PFC mRNA level of genes encoding synaptic components/ion channels identified as significantly downregulated via RNA-seq. n = 10–17 mice/group. F, Bar graph comparing WT and 16p11.2dp/+ PFC mRNA level of genes related to ASD/ID identified as significantly downregulated via RNA-seq. n = 6–20 mice/group. G, Bar graph comparing WT and 16p11.2dp/+ PFC mRNA expression level of the GABA synapse regulator Npas4. n = 15–22 mice/group. H, Bar graph showing NPAS4 protein expression level in nuclear fractions isolated from WT and 16p11.2dp/+ PFC. Inset: representative immunoblot images. n = 9–10 mice/group. I, Bar graph showing Npas4 mRNA expression in human postmortem PFC tissue from healthy controls and ASD patients. n = 8–9/group. J, Bar graph comparing WT and 16p11.2dp/+ PFC mRNA expression level of Npas4 and the 16p11.2 gene Mapk3 in striatum. n = 4–7 mice/group. K, Bar graph comparing WT and 16p11.2dp/+ PFC mRNA level of genes related to GABAergic synaptic transmission. n = 6–19 mice/group. All data are presented as mean ± SEM. In panel E, * p < 0.05; ** p < 0.01.

