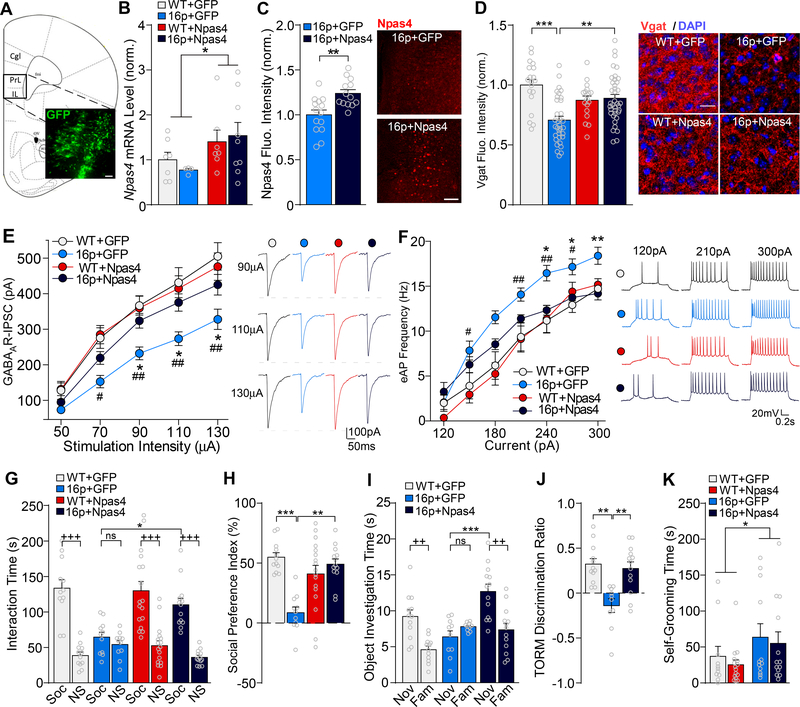
Figure 5.
Restoring Npas4 expression in PFC ameliorates the social and cognitive deficits and restores GABAergic synaptic transmission in 16p11.2dp/+ mice. A, Immunofluorescent image showing the location of GFP expression in a viral-injected mouse. Scale bar = 50 μm. B, Bar graph showing Npas4 mRNA levels in PFC of WT or 16p11.2dp/+ mice injected with GFP or Npas4 virus. n = 4–9 mice/group. C, Bar graph showing Npas4 fluorescence intensity in mPFC of GFP-injected and Npas4-injected 16p11.2dp/+ mice. Inset: representative images showing Npas4 expression in mPFC of both groups. Scale bar = 100 μm. n = 13–14 slices, 3–4 mice/group. D, Bar graph showing VGAT immunostaining fluorescence intensity in mPFC (prelimbic area) of WT and 16p11.2dp/+ mice injected with GFP or Npas4 virus. Inset: representative images showing VGAT (red) and DAPI (blue) staining. Scale bar = 20 μm. n = 18–38 slices, 2–3 mice/group. E, F, Plot of input-output curves of GABAAR-IPSC (E) and AP firing frequencies (F) in mPFC pyramidal neurons from WT or 16p11.2dp/+ mice injected with GFP or Npas4 virus. Insets: representative GABAAR-IPSC and AP firing traces. GABAAR-IPSC: n = 9–25 cells, 3–4 mice/group; eAP: 11–17 cells, 3–4 mice/group. G, H, Bar graphs showing the amount of time spent interacting with Soc vs. NS stimuli (G) and the social preference index (H) in the 3-chamber social preference test of WT or 16p11.2dp/+ mice injected with GFP or Npas4 virus. n = 11–17 mice/group. I, J, Bar graphs showing the amount of time spent interacting with the novel (Nov) vs. familiar (Fam) objects (I) and the discrimination ratio (J) in the TORM test of WT or 16p11.2dp/+ mice injected with GFP or Npas4 virus. n = 10–13 mice/group. K, Bar graphs showing self-grooming time in WT or 16p11.2dp/+ mice injected with GFP or Npas4 virus. n = 11–16 mice/group. All data are presented as mean ± SEM. In all figures, *, # p < 0.05; **, ## p < 0.01; ***, +++ p < 0.0001; ns = not significant. In figures E/F, *: 16p+GFP vs. 16p+Npas4; #: 16p+GFP vs. WT+GFP.

