
Figure 2: Localization performance of U-Net segmentation for pneumonia detection at the optimal operating threshold.
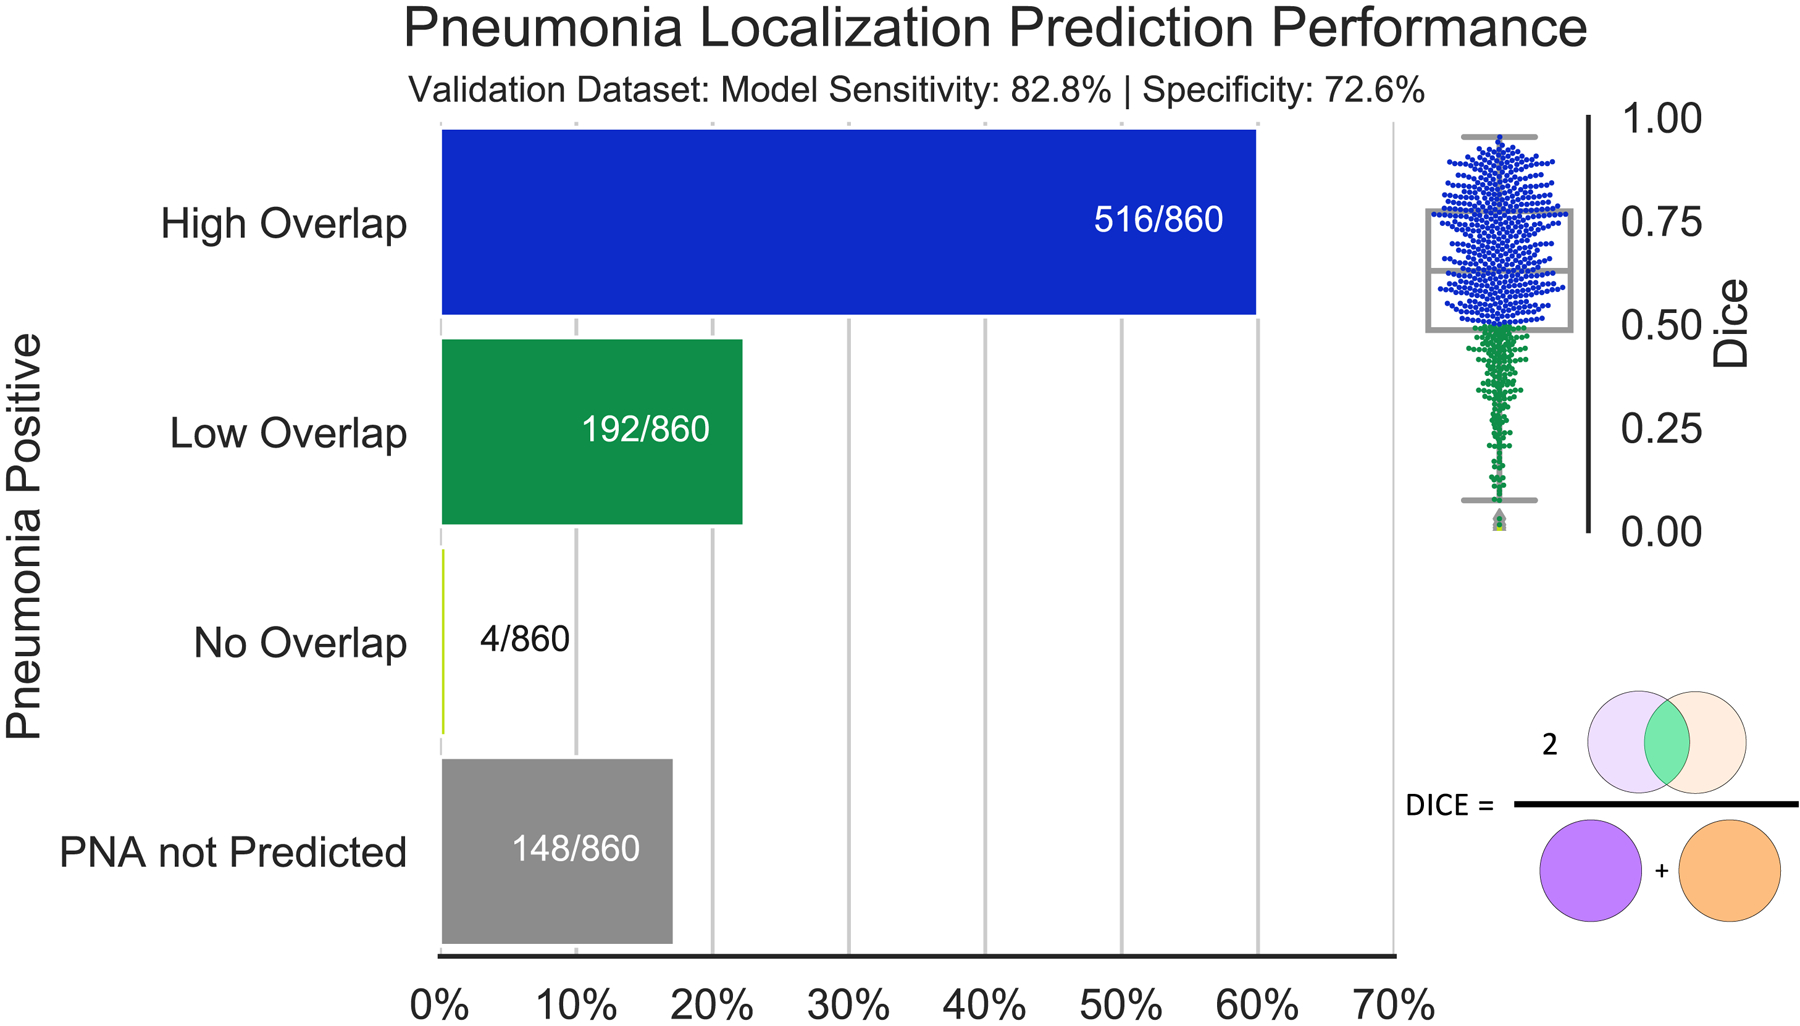
Dice scores (0=no overlap; 1=perfect overlap) are shown in the box & whisker/feather plot on the upper right. 60.0% of pneumonia-positive radiographs have dice scores between 0.5 and 1 which are considered high overlap. 22.3% have dice scores between 0 and 0.5, and 0.5% have dice scores of 0 corresponding to a positive pneumonia prediction but no localization overlap with radiologist annotations. Finally, 17.2% of the radiographs assigned pneumonia were not predicted as such.