
Figure 1. The relationship between stress and exhaustion: Moderation by sleep duration.
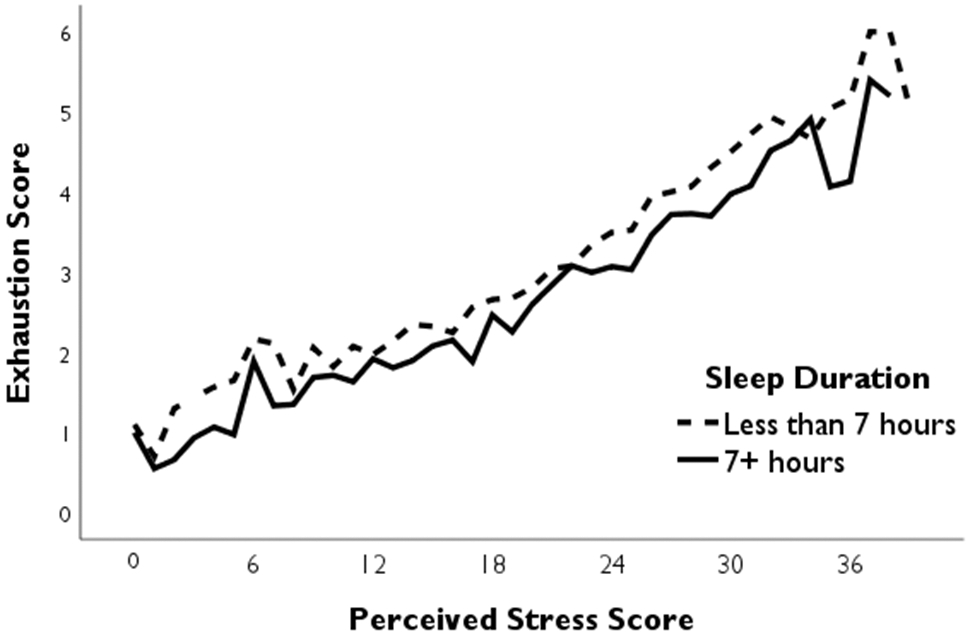
Note. This figure represents a significant (p<0.001) moderation of the relationship between stress and exhaustion by sleep duration, such that the association between stress and exhaustion lessened as sleep duration increased. Perceived stress scores range from 0 to 40 and exhaustion scores range from 0 to 6. Breaks in the graph are present at stress and exhaustion scores that did not exist in the data. Although measured continuously, sleep duration was separated into “less than 7 hours” and “7+ hours” for visual representation purposes.