
Figure 2. The relationship between stress and exhaustion: Moderation by sleep quality.
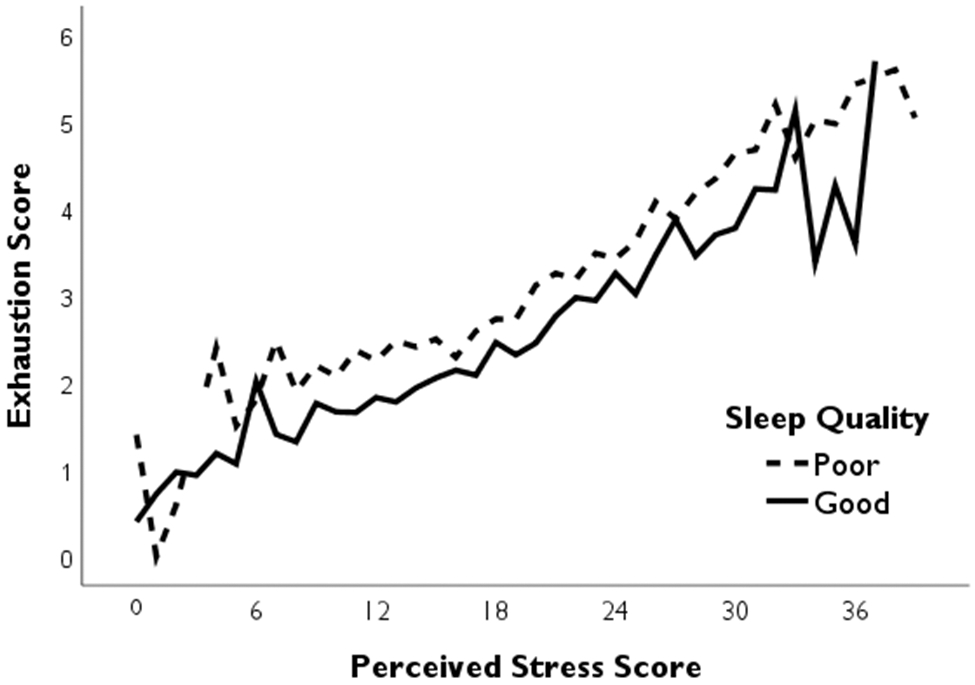
Note. This figure represents a significant (p<0.001) moderation of the relationship between stress and exhaustion by sleep quality, such that the association between stress and exhaustion was weaker among students with good sleep quality when compared with those with poor sleep quality. Perceived stress scores range from 0 to 40 and exhaustion scores range from 0 to 6. Breaks in the graph are present at stress and exhaustion scores that did not exist in the data. Participants who had “fairly poor” or “very poor” sleep quality were classified as having poor sleep quality. Participants who had “fairly good” or “very good” sleep quality were classified as having good sleep quality.