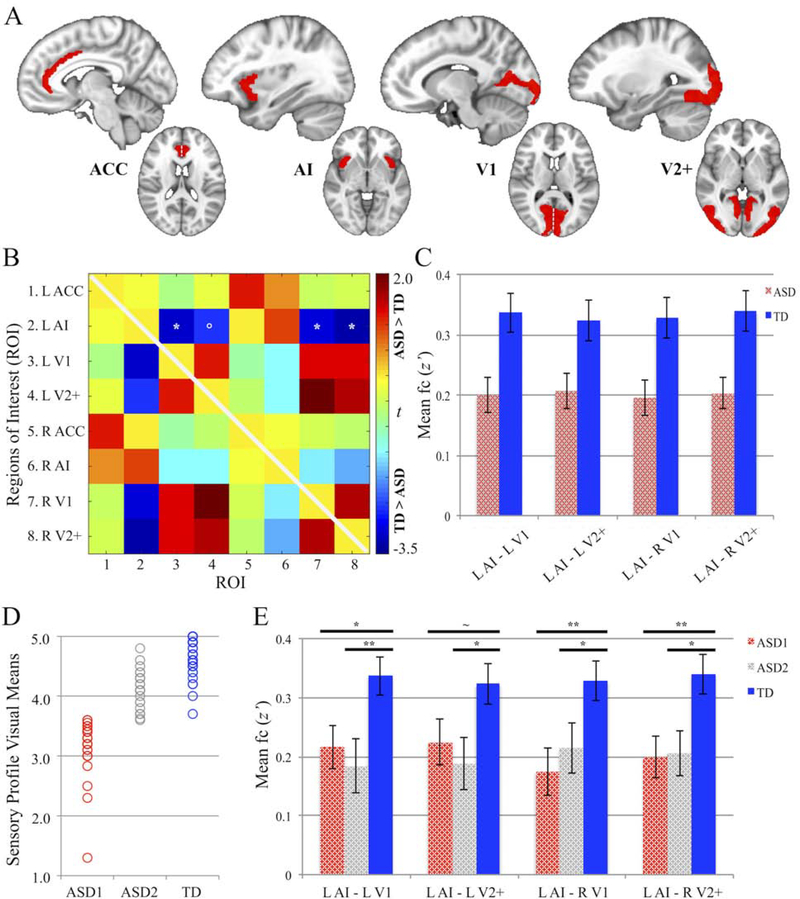
Figure 1.
Functional Connectivity Patterns Between Visual and Salience Network Regions
Note: (A) Regions-of-Interest (ROIs) derived from Harvard-Oxford and Jülich Histological atlases; dashed white line in axial slice (ACC, V1) delineates left (L) and right (R) hemisphere ROIs. (B) Between-group differences (ASD vs. TD) in ROI-to-ROI functional connectivity (t; both triangles identical); significance levels are FDR-corrected. (C) Group mean functional connectivity (z’) for four underconnected ROI-to-ROI pairings. (D) Two ASD subgroups (ASD1, ASD2) determined using median split of mean scores from the Sensory Profile Visual Processing section; visual means shown in comparison to TD group. (E) Between-group statistical comparisons of mean functional connectivity (z’) for the four underconnected ROI-to-ROI pairings in 2 ASD subgroups and TD group. Error bars represent SE. ACC = anterior cingulate cortex; AI = anterior insula; ASD = autism spectrum disorder; FDR = false discovery rate; TD = typically developing; V1 = primary visual cortex; V2+ = secondary visual and extrastriate cortices.
** p≤ .01, * p≤ .05, ~p ≤ .075, ° p≤ 0.10

