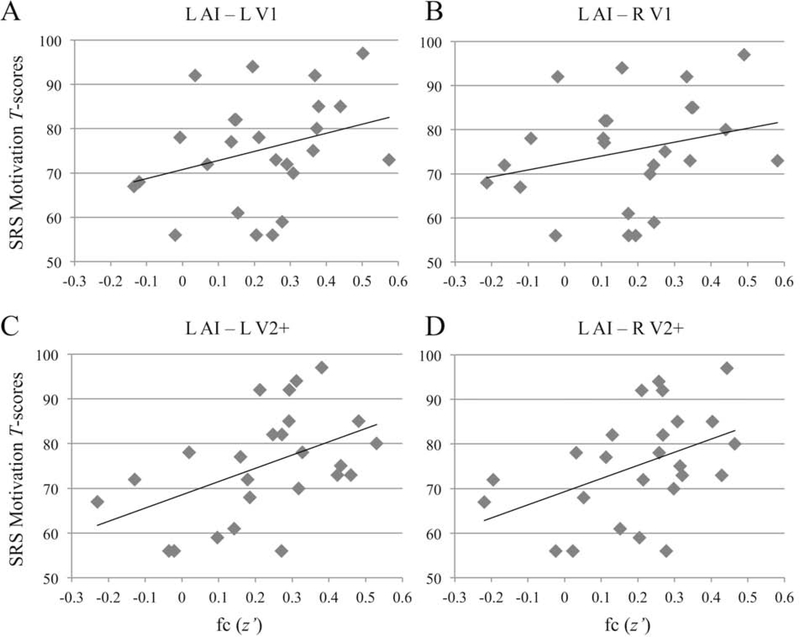
Figure 2.
Correlational Findings Between Social Motivation and Functional Connectivity
Note: Plots depict zero-order correlations in the ASD1 subgroup between SRS Motivation subscale T-scores and functional connectivity (z’) in the ROI-to-ROI pairings from left AI to: (A) left V1; (B) right V1; (C) left V2+; (D) right V2+. ACC = anterior cingulate cortex; AI = anterior insula; ROI = Region-of-Interest; SRS = Social Responsiveness Scale; V1 = primary visual cortex; V2+ = secondary visual and extrastriate cortices.

