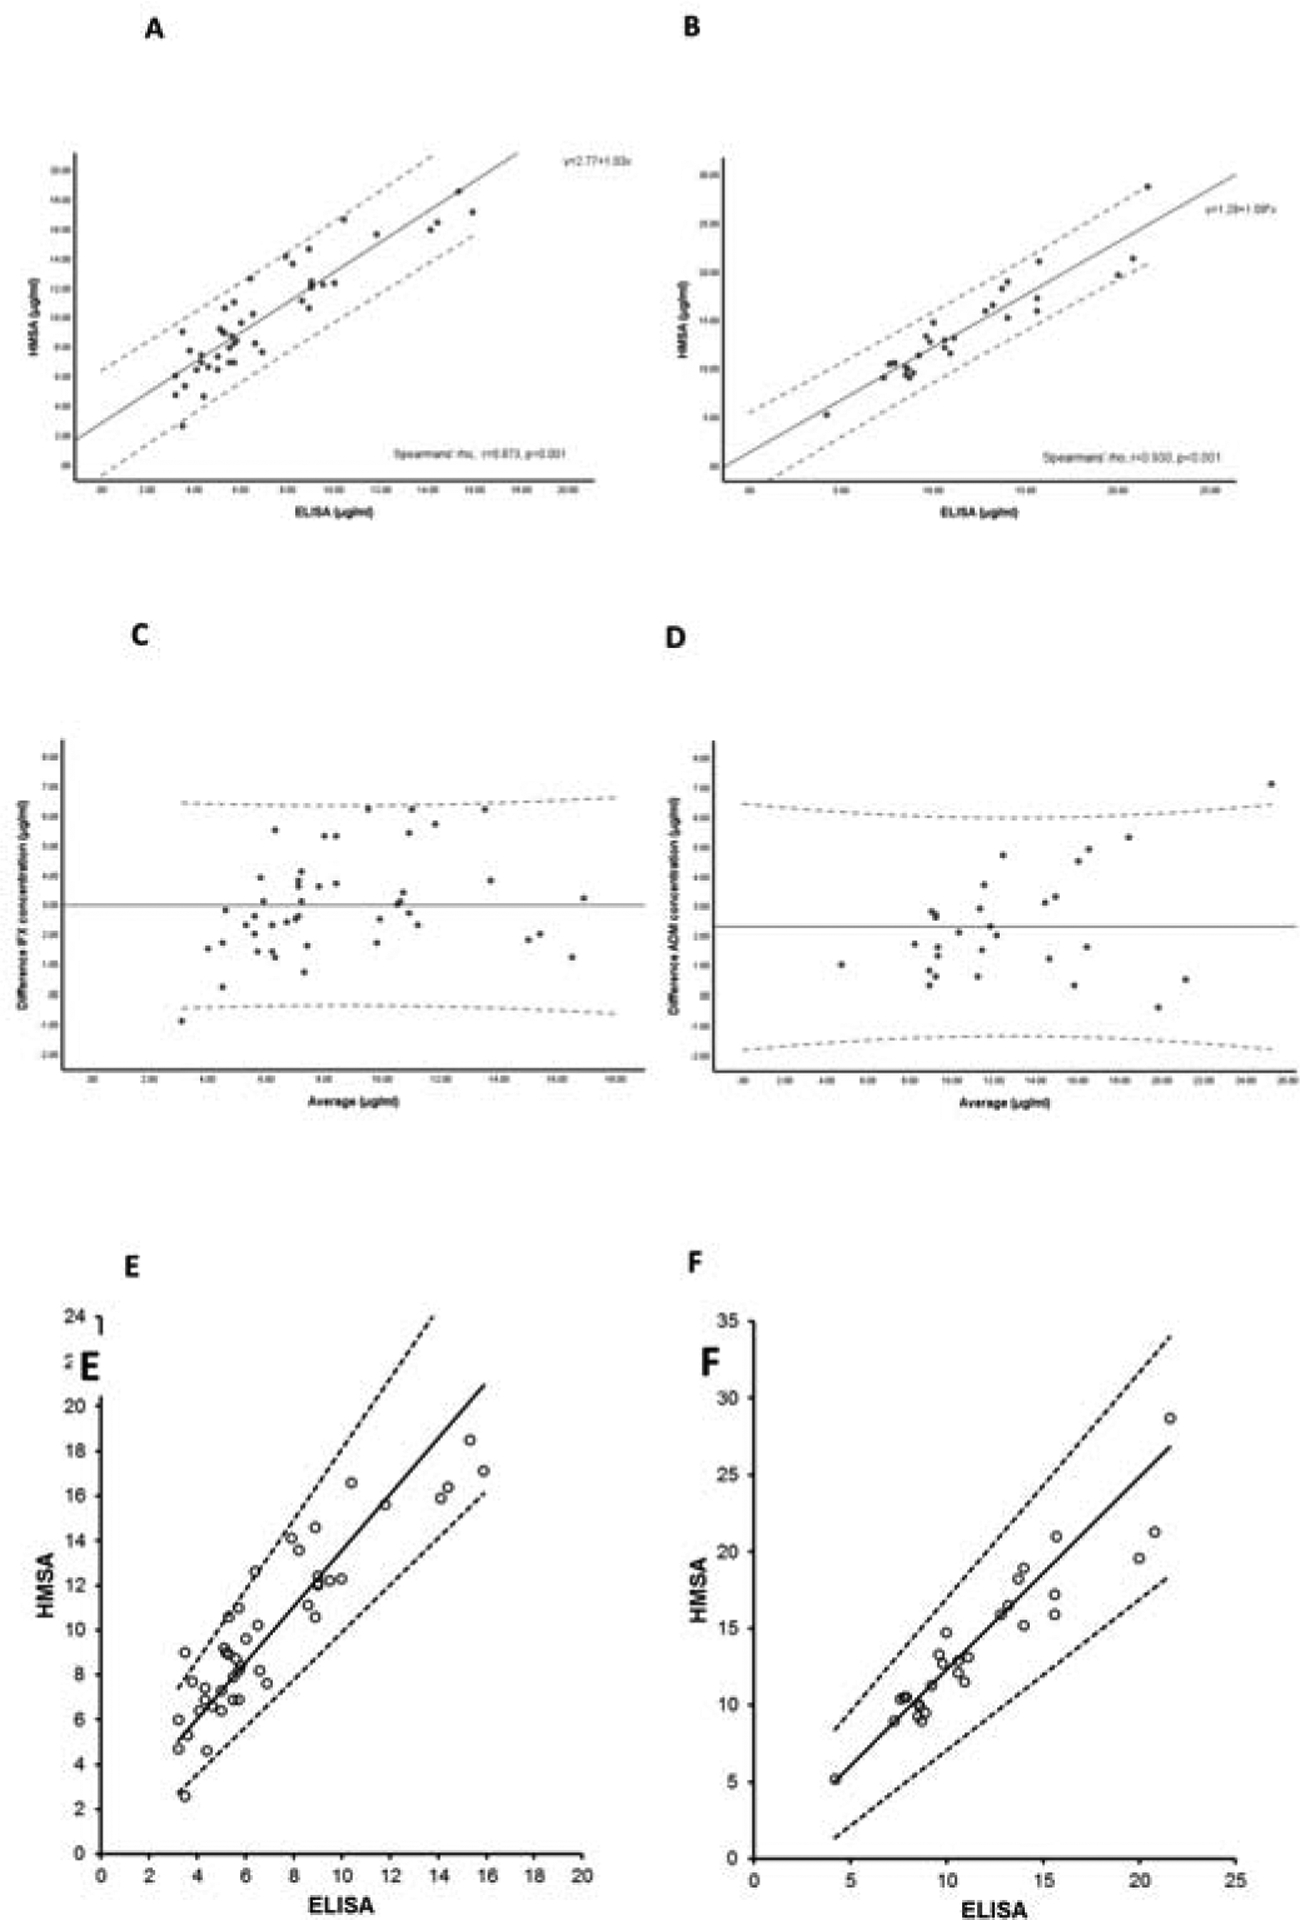
Figure 1.

Correlation of infliximab (A) and adalimumab (B) concentrations between assays. Scatter plot with solid line representing fitted regression line and dashed lines the 95% confidence interval for the regression line. Bland–Altman plot of infliximab (C) and adalimumab (D) concentrations to compare the two assays: the difference between two measurements (mg/L) is plotted on the Y-axis and the average of the two measurements (mg/L) on the X-axis. Dotted lines represent the 5–95% limits of the mean difference (solid line). Passing and Bablok plots for infliximab (E) and adalimumab (F) according to assay. Scatter plot with solid line representing fitted regression line and dashed lines the 95% confidence (CI) interval for the regression line. For infliximab (slope: 1.25; 95%CI: 1.05–1.57 and intercept: 1.04; 95%CI: −0.63 to 2.37) and for adalimumab (slope: 1.25; 95%CI: 0.98–1.47 and intercept: −0.24; 95%CI: −2.76 to 2.21).
IFX: infliximab; ADM: adalimumab.
