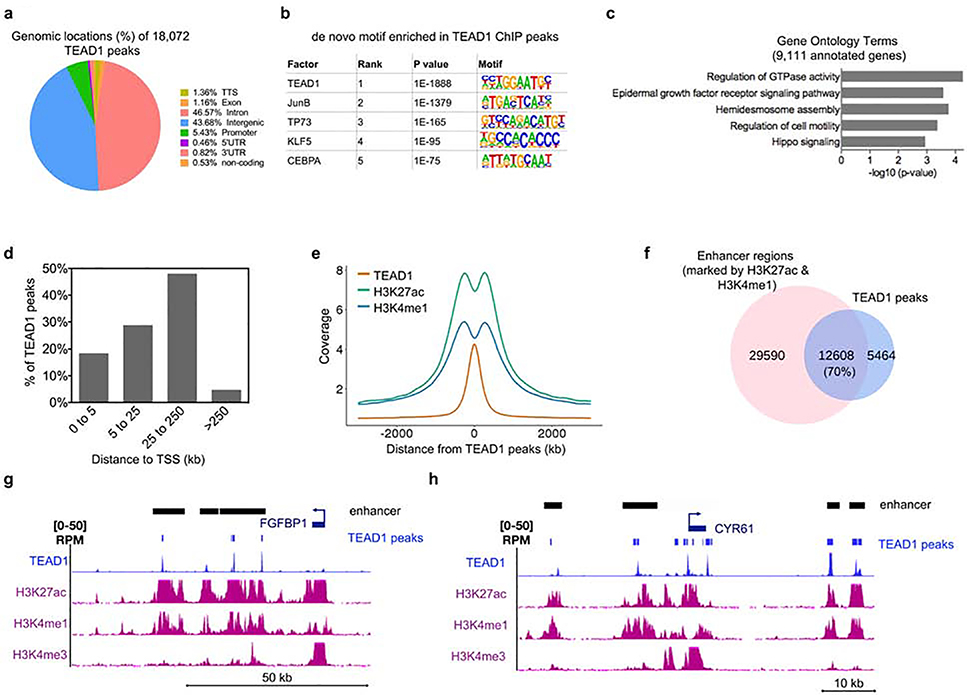
Figure 2. ChIP-Seq analysis of TEAD1 genome-wide binding sites shows that TEAD1 is primarily associated with active enhancers.
(a) The 18,072 TEAD1 significantly bound peaks were mapped back to various regions of the genome. The percentage of the TEAD1 peaks found within each region of the genome is shown. (b) De novo motif search for TEAD1 bound peaks. (c) The 18,072 TEAD1 bound peaks were mapped back to 9,111 genes. Gene ontology analysis of the 9,111 annotated genes was performed using Enrichr. (d) Bar graph from GREAT analysis showing the percent distribution of TEAD1 peaks in relation to the transcription start site (TSS) of genes. Distance to TSS is shown in kilobases (kb). (e) Distribution of H3K27ac and H3K4me1 centered around TEAD1 peaks. Distance to TEAD1 peaks is shown in kb. (f) Overlap between TEAD1 peaks and active enhancer regions (marked by the presence of both H3K27ac and H3K4me1). (g-h) Gene tracks showing TEAD1 (blue), H3K27ac (purple), H3K4me1 (purple), and H3K4me3 (purple) binding. Active enhancer (shown as black bars) regions are shown as regions that have H3K27ac and H3K4me1 peaks without the presence of H3K4me3. The presence of H3K4me3 is used to rule out gene promoters and gene bodies.

