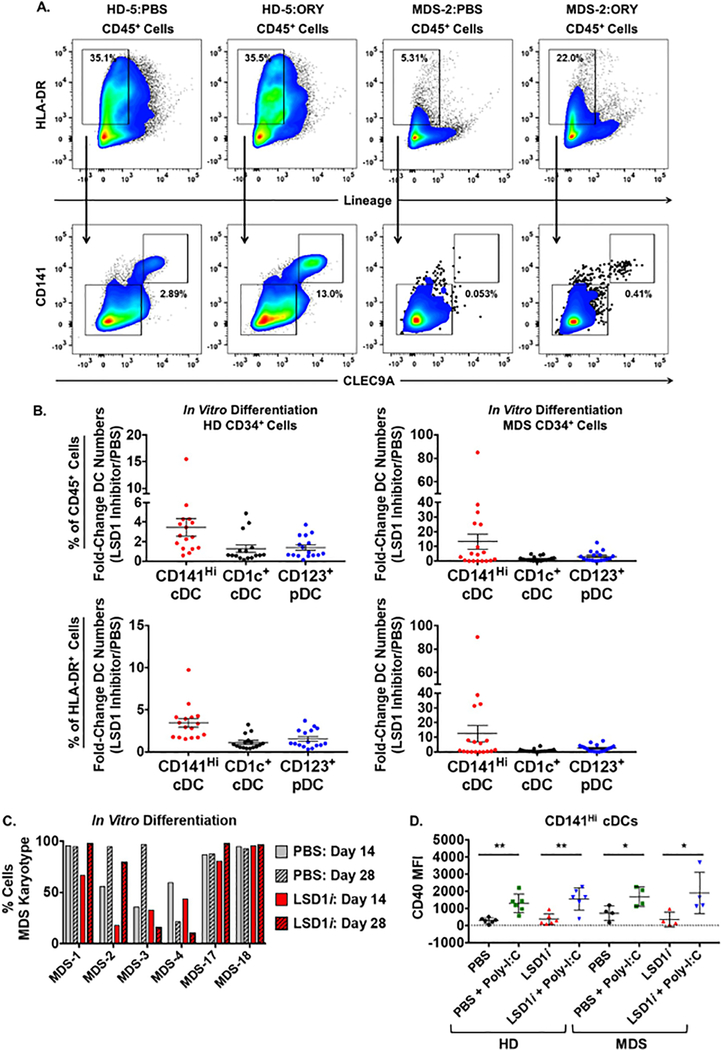
Figure 3. LSD1 Inhibition Enhances CD141Hi cDC Differentiation of MDS CD34+ Progenitors.
CD34+ cells from healthy donors (HD, n = 12 different donors) and MDS patients (n = 12 different specimens) were cultured as described in the “Methods” section. Measurement of CD141Hi cDC differentiation was performed using flow cytometry at the end of the culture period (28 days). CD141Hi cDCs were defined by the immunophenotype: human CD45+, lineage-negative (lin-), HLA-DR+, CD14-, CD1c-, CD141Hi, CLEC9A+. (A) Flow cytometry analysis of Lin-, HLA-DR+ (Top) and CD141Hi, CLEC9A+ (Bottom) populations following culture of HD-5 (left) and MDS-2 (right) CD34+ cells treated with PBS or ORY. (B) Fold-change in CD141Hi cDCs (red circles), CD1c+ cDCs (black circles) and CD123+ pDCs (blue circles) numbers following in vitro differentiation of HD (left) and MDS (right) CD34+cells treated with GSK or ORY compared to PBS. Fold-change was calculated based on the percentage of CD141Hi cDCs in total human CD45+ cells (Top) or HLA-DR+ cells (Bottom). Data are presented as values for individual specimens. Specimens treated with GSK or ORY have been pooled together. Some specimens were treated with GSK and ORY (not in the same culture) and the superior effect is shown. See Supplemental Figure 3 for results of individual cultures. 3–5 technical replicates were performed for each sample and averaged together. Horizontal bars represent the mean value and error bars represent standard error of the mean. (C) Percentage of cells with an MDS-defining karyotype during in vitro differentiation of CD34+ cells (treated with PBS (gray bars) or GSK/ORY (LSD1i: red bars) (red bar). MDS karyotypes were defined as Del(−5q)/Monosomy 5 (MDS-1, MDS-2, MDS-17), Del(−7q)/Monosomy 7 (MDS-3, MDS-18) or trisomy 8 (MDS-4). Karyotypes were detected using FISH as described in “Methods” after 14 days (post-expansion) and 28 days (post-differentiation). 100 total cells were scored for all treatment and timepoints with the following exceptions: MDS-3 (LSD1i, Day 28) = 55 cells; MDS-4 (PBS, Day 14) = 48 cells; MDS-4 (LSD1i, Day 14) = 52 cells. (D) Flow cytometry analysis of CD40 expression in in vitro differentiated CD141Hi, CLEC9A+ cells following stimulation with poly-I:C. HD (n = 6, left) and MDS (n = 4, right) CD34+ cells were treated with PBS or GSK as described in the “Methods” section. Horizontal bars represent the mean value and error bars represent standard deviation. p-values were obtained using unpaired t-test: * = p < 0.05; ** = p < 0.01.

