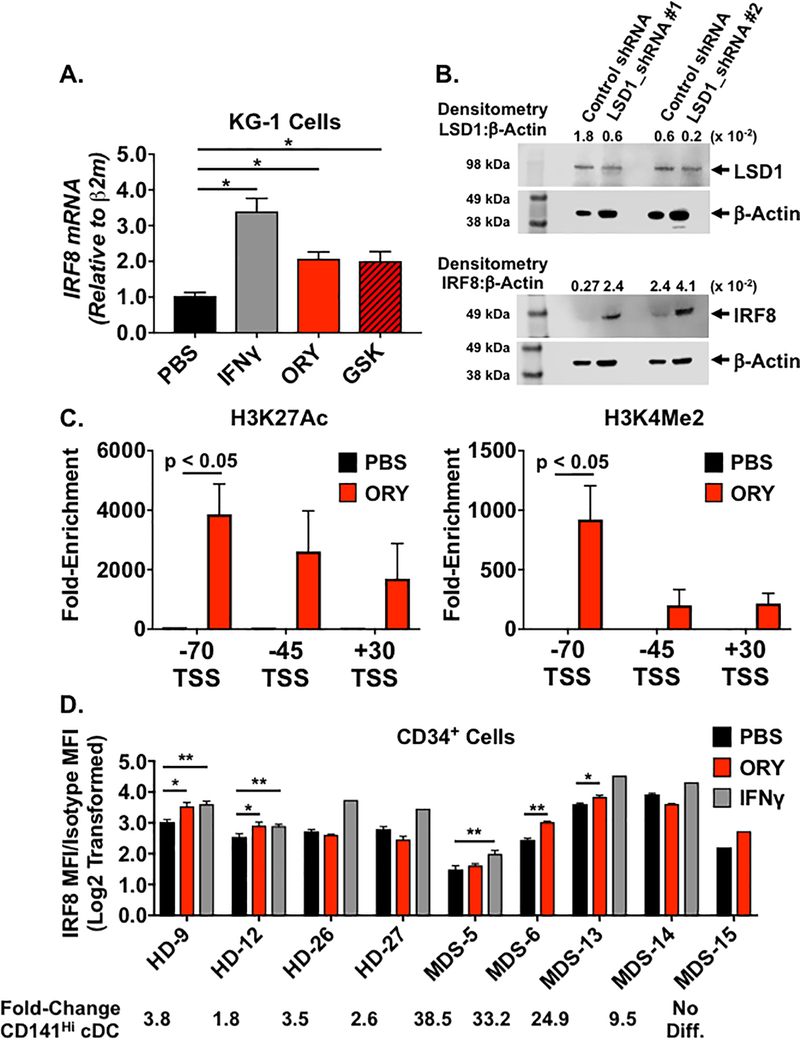
Figure 4. LSD1 Inhibition Enhances IRF8 Expression and Promotes Histone Acetylation and Demethylation at the IRF8 Locus.
(A) Average IRF8 mRNA levels in KG-1 cells treated with the LSD1 inhibitors GSK2879552 (GSK, Left) or ORY-1001 (ORY, right). Cells were treated for 72 hours with PBS vehicle (black bar), 1 μM GSK or 0.5 μM ORY (red bar), or 50 units/ml interferon-gamma (IFNγ, gray bar), n = 3 – 5 for each condition. IRF8 mRNA was quantified using qPCR and normalized to Beta-2-microglobulin (β2M) mRNA. (B) LSD1 (Top) and IRF8 protein levels in KG-1 cells transduced with scramble control shRNA, LSD1_shRNA #1, or LSD1_shRNA #2 lentiviral vectors. Protein was measured using Western blot analysis. Separate blots for LSD1 and IRF8 were run in parallel using the same protein lysate for each condition. β-Actin protein acted as a loading control. All blot images have been cropped for clarity and the uncropped images are shown in Supplemental Figure 4. Bands corresponding to LSD1 (≈ 94 kDa), IRF8 (50 kDa), and Actin (43 kDa) are marked with black arrowheads. Densitometry values showing the ratio of LSD1:β-Actin and IRF8:β-Actin are shown. (C) Average fold-enrichment of H3K27 acetylation (H3K27Ac, Left) and H3K4 dimethylation (H3K3Me2) at regions located −70, −45, and +30 kb relative to the IRF8 transcriptional start site in KG-1 cells. H3K27Ac and H3K4Me2 levels were quantified using chromatin immunoprecipitation (ChIP) followed by quantitative PCR and were calculated by normalizing anti-H3K27Ac or antiH3K4Me2 to isotype controls. ChIP assays were performed on KG-1 cells 72 hours after treatment with PBS (black bar) or ORY (red bar). (D) Average IRF8 protein levels (calculated as described under “Methods”) in healthy donor (HD, 4 different donors) and MDS (5 different patients) CD34+ cells treated with PBS vehicle, 0.5 μM ORY, or 100 units/ml IFNγ (n = 3 replicates per individual specimen unless noted otherwise). For MDS-6 and MDS-15, cell numbers limited the treatments to PBS or ORY. Analysis of MDS-15 was limited to a single replicate. For HD-26, HD-27, MDS-13, and MDS-14, cell numbers limited the treatment with IFNγ to a single replicate. IRF8 protein was quantified using flow cytometry and normalized to isotype control. For all samples, the fold-changes in CD141Hi cDC numbers following treatment with LSD1 inhibitor compared to PBS (see Supplemental Figure 3) are depicted below the graph. Horizontal bars represent the mean value and error bars represent standard deviation. p-values were obtained using unpaired t-test: * = p < 0.05; ** = p < 0.01.

