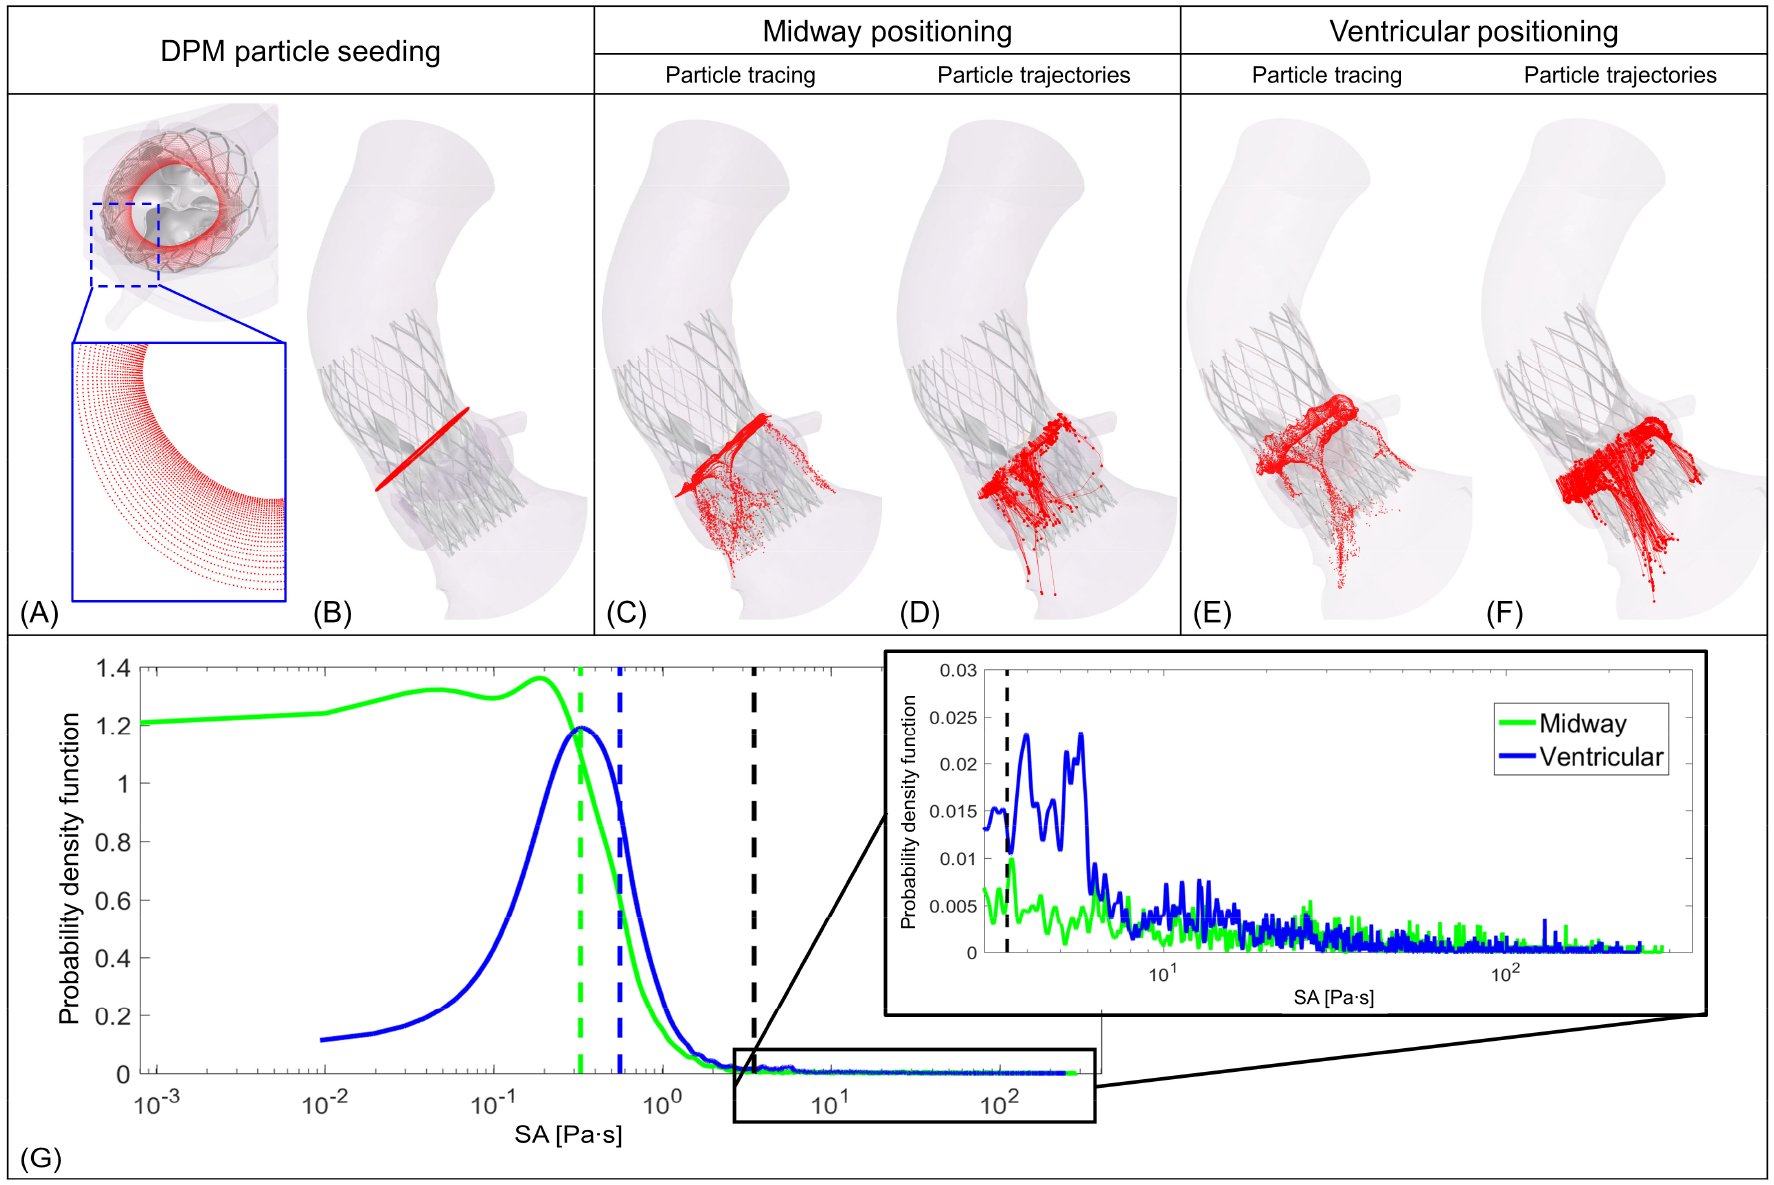
Figure 2:

(A) DPM platelet seeding pattern based on our previous study of optimal seeding pattern for TAVR study [11, 28]. (B) Position from where the platelets were released. C and E represent platelet tracing for midway and ventricular positionings, respectively. D and F correspond to the trajectories of the platelets that are exposed to more the 3.5 Pa·s stress for midway and ventricular positionings, respectively. (G) shows PDFs of SA calculated for each configuration; the dashed line represents the median SA for Midway (green) and ventricular (blue) positioning and black dashed line represents the Hellum’s criterion for platelet activation [28].
