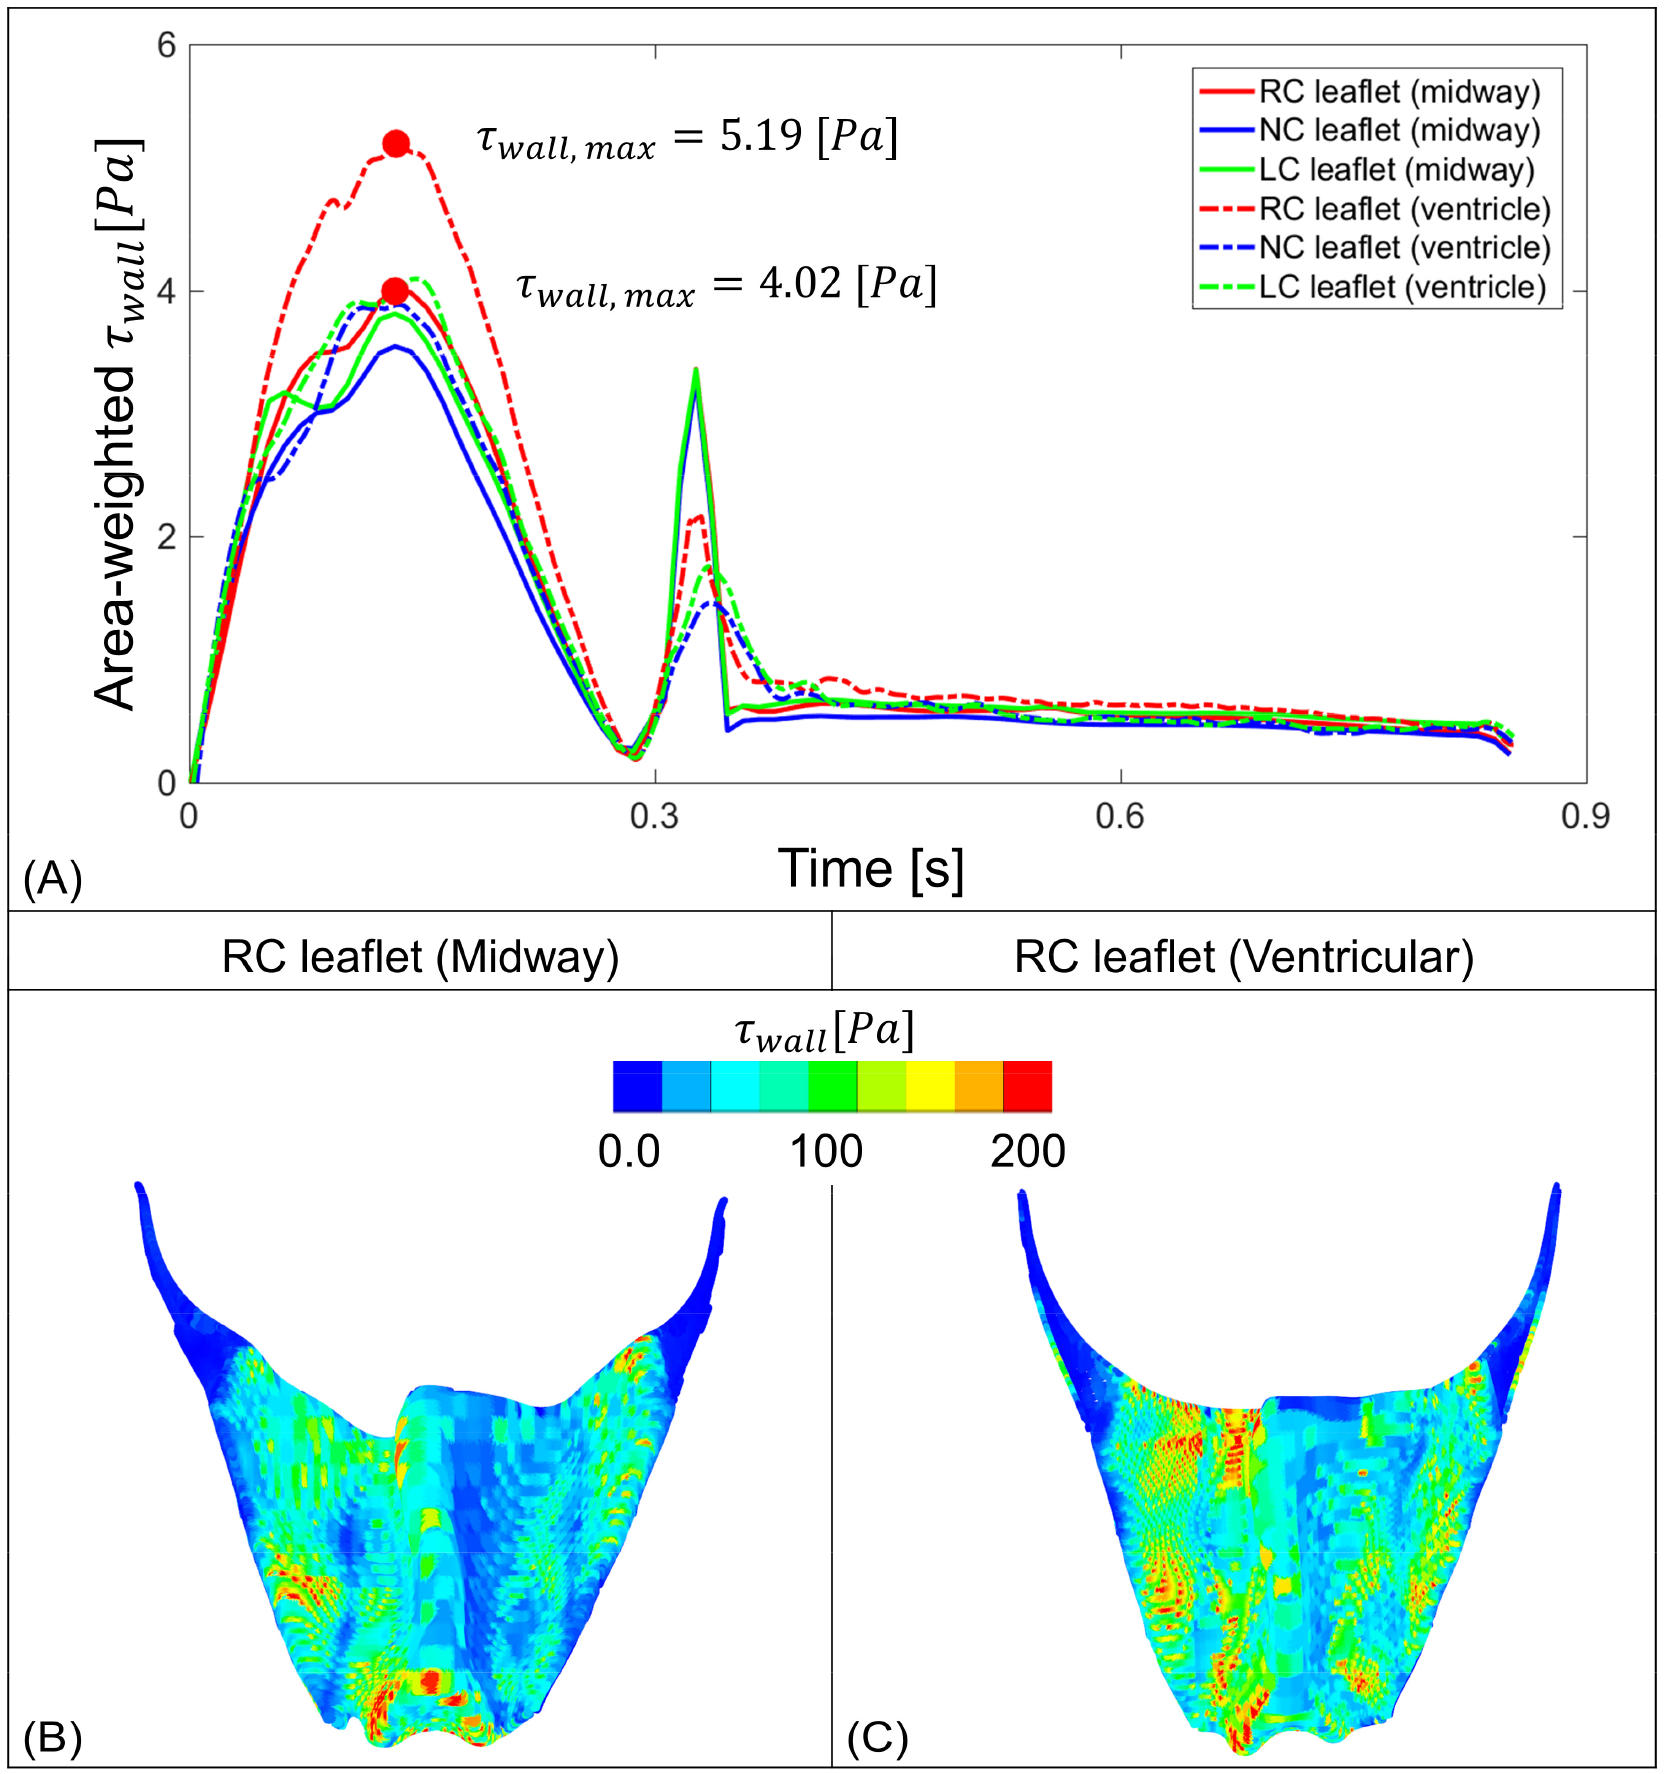
Figure 7:

Flow stress observed on the prosthetic leaflets. (A) represent area-weighted stress on the three TAVR valve leaflets throughout a cardiac cycle, where the dot represents the maximum stress value over time. B and C depict instances where leaflet from each case experienced the maximum area-weighted wall stress (red dots on panel A) calculated throughout the cardiac cycle.
