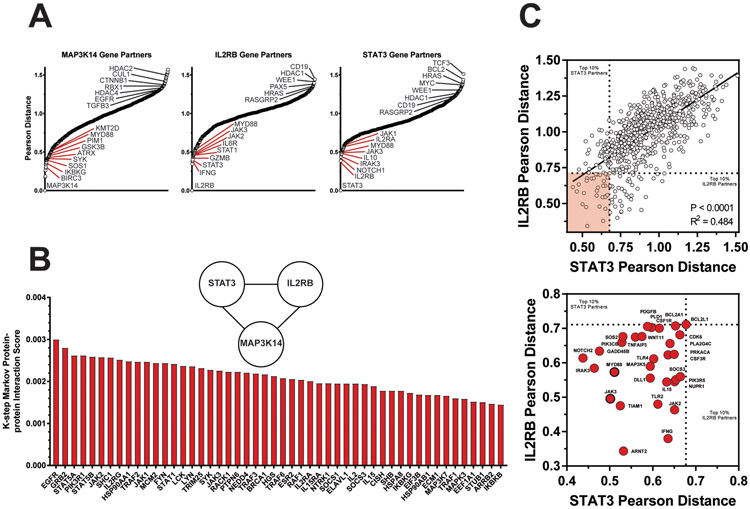
Figure 4: Nearest Neighbor Analysis of Top Responder Genes Reflect NF-κB, JAK/STAT, and Cytokine Signaling Programs.
(A) Plots illustrate ranked Pearson distance between responder genes and the other 729 PanCan genes. For each plot, genes to the left of the X-axis and designated in red represent genes with similar expression profiles as the target gene. Those with greater Pearson distance are plotted to the right and exhibit dissimilar expression patterns to the target gene. (B) A bar graph highlights the top 50 protein-protein interaction partners between MAP3K14, IL2RB, and STAT3 based on k-step Markov distance. (C) A scatter plot documents the correlative genetic partners of IL2RB and STAT3 for all genes. Dotted lines designate limits for top 10% closest genes to each. 23/730 genes meet these criteria and are shaded in red. A zoomed view of these gene neighbors is displayed in the bottom plot. MYD88 and JAK3 are also top 10% gene partners with MAP3K14 and highlighted with a dark border.

