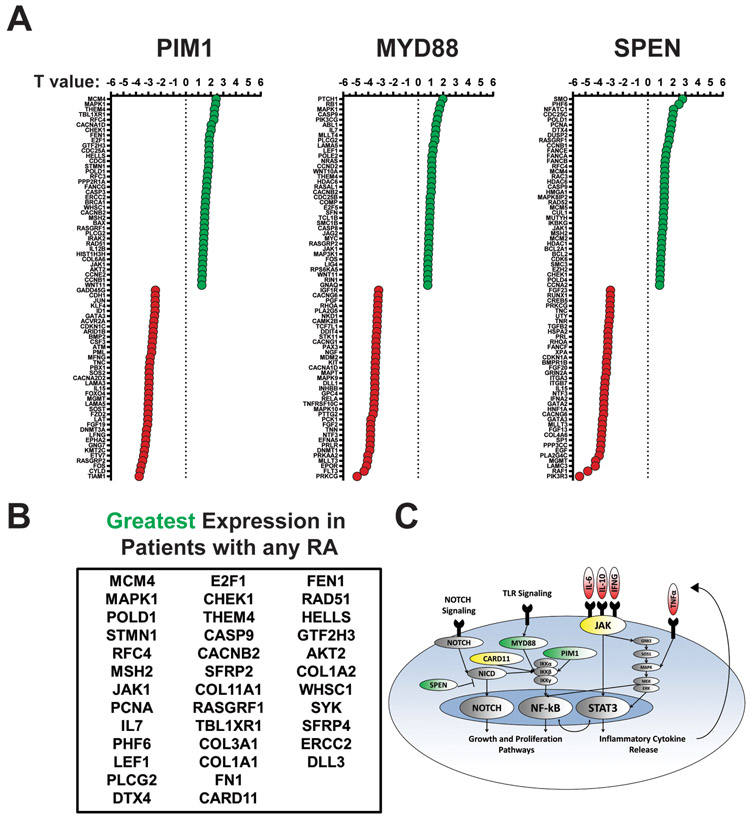
Figure 5: Responder Alterations Correspond to Distinct RNA Expression Profiles.
Combined data from 44 cases that had paired WES and PanCan data was used for analysis, R2CHOP (N=13) RCHOP (N=31). 15 patients had at least one RA. (A) The top 5% and bottom 5% (N=37 each) of genes associated with the presence of each RA are visualized through dot plots. Genes with greater differential expression in the presence of an RA are closer to the top (greater T value; green) and genes with lesser expression in the presence of an RA are closer to the top (lower T value; red). Each RA is individually documented. (B) The table documents genes associated with greater differential expression in the presence of any RA. (C) A graphic summarizes the DNA alterations and the hypothesized high-risk phenotype. RA are designated green, genes associated with greater expression in yellow, and hypothesized cytokines in red.

