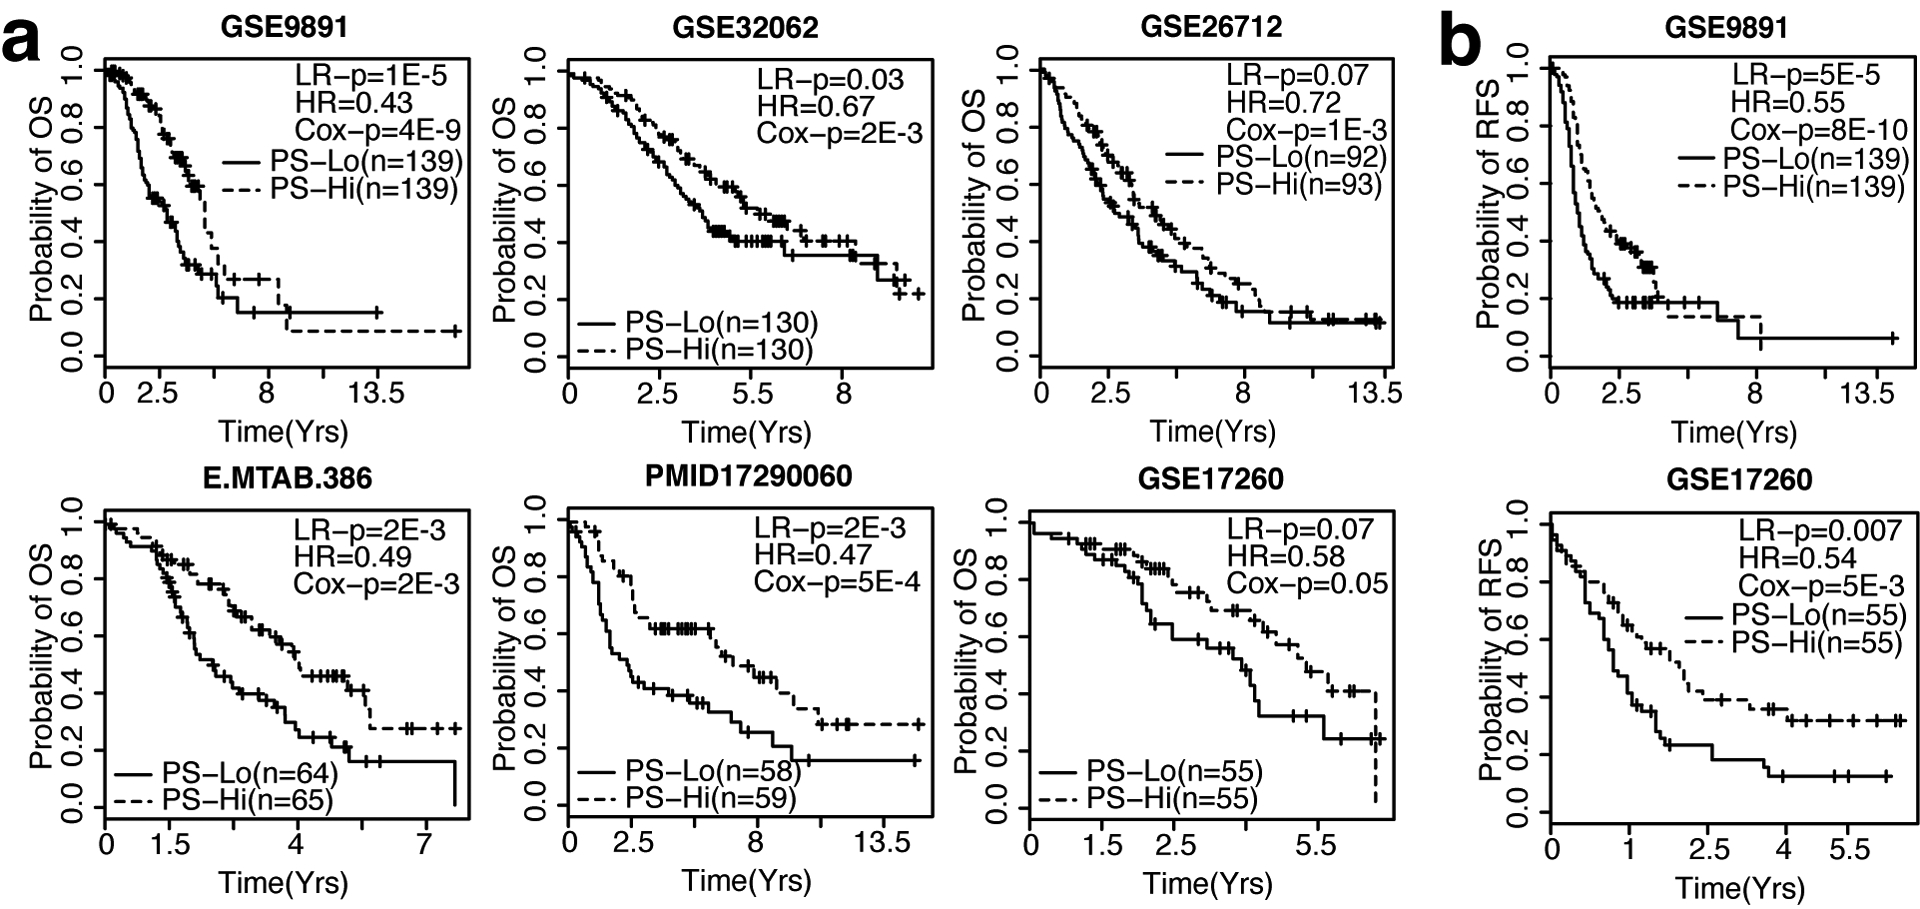
Figure 1: The OV signature is predictive of patient survival in 6 independent ovarian cancer gene expression datasets.

a. Kaplan-Meier curves depicting overall survival (OS) probability over time, ordered by sample size (n). b. Kaplan-Meier curves depicting recurrence-free survival (RFS) probability over time, ordered by n. For all Kaplan-Meier curves, patients were dichotomized into PS-high (red) and PS-low (blue) using median PS as threshold. LR-p = p-value of Log Rank test, HR = Hazard Ratio, Cox-p = p-value calculated from the univariate Cox regression model in which PS is used as the only variable.
