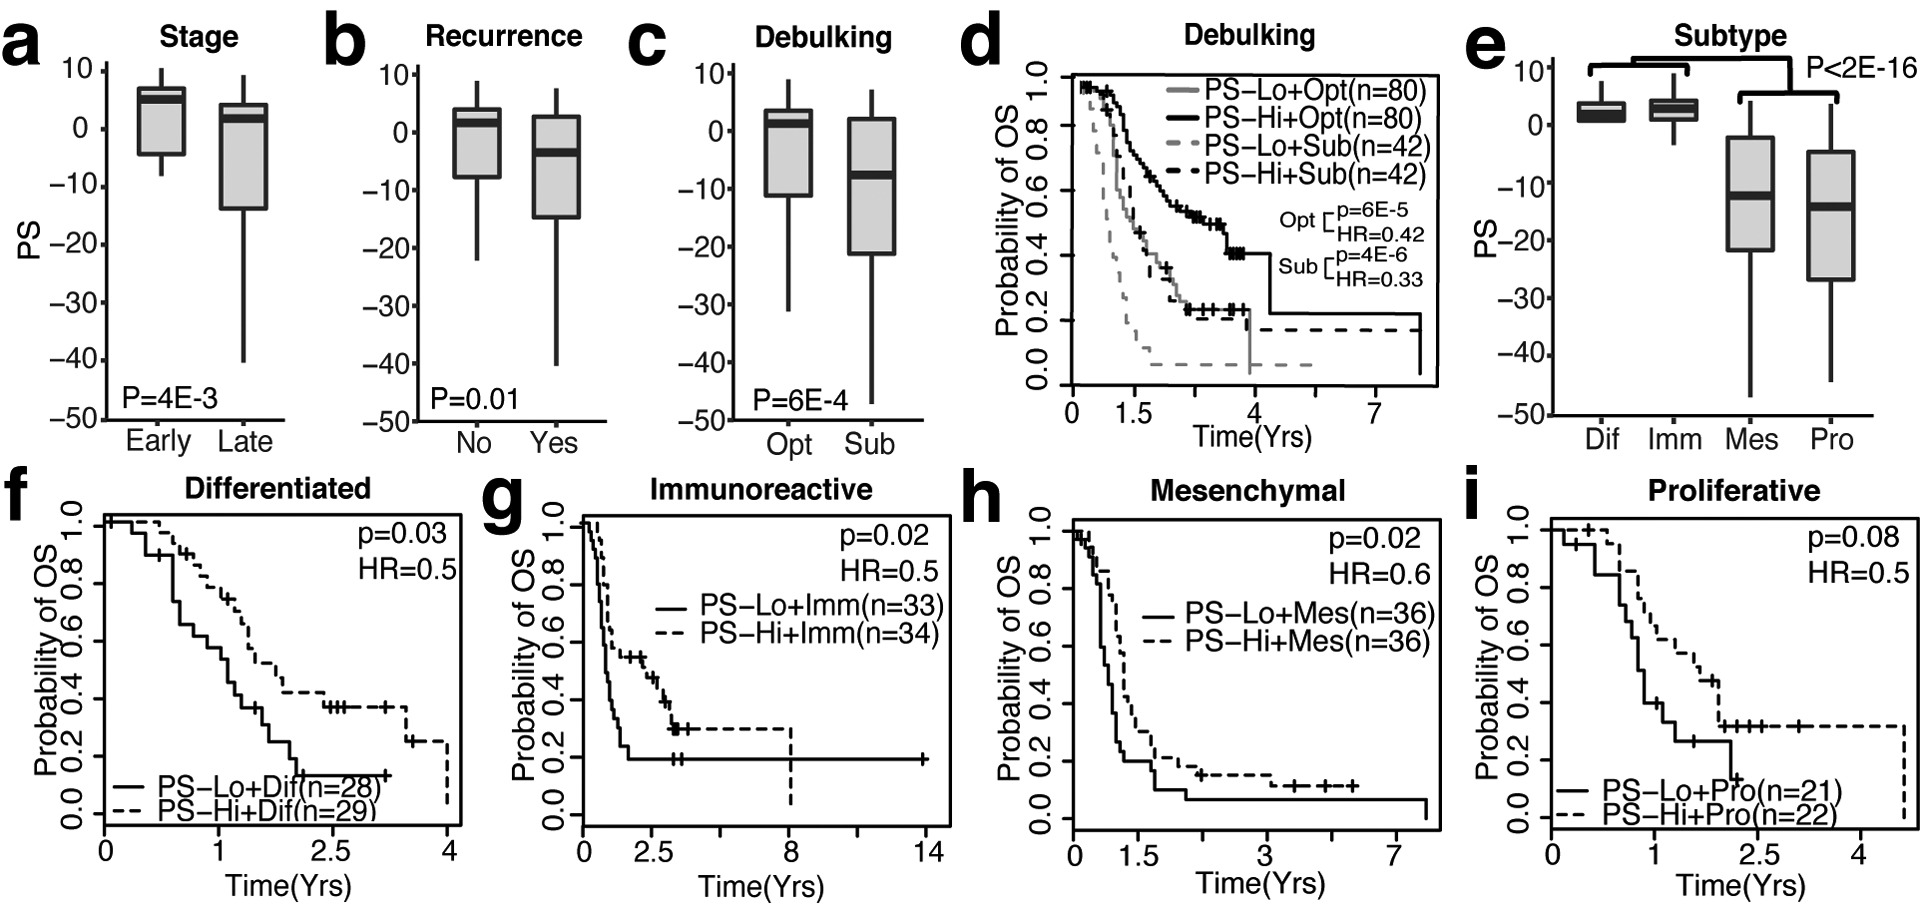
Figure 3: The OV signature can be used to stratify individual clinical variables.

a. Box plot of PSs in samples from early (1 and 2) and late stages (3 and 4), Wilcoxon Rank-Sum Test. b. Box plot of PSs comparing samples with non-recurrent and recurrent events, Wilcoxon Rank-Sum Test. c. Box plot of PSs in samples classified as optimal (Opt) and suboptimal (Sub), Wilcoxon Rank-Sum Test. d. Kaplan-Meier plot depicting survival probability of optimal and suboptimal patients stratified by high-PS or low-PS (based on median PS), Log-rank Test. e. Box plot of PS in differentiated (Dif), Immune (Imm), Mesenchymal (Mes), and Proliferative (Pro) OV subtypes, Wilcoxon Rank-Sum Test. Kaplan-Meier plots depicting survival probability of PS-high and PS-low samples in f. Differentiated, g. Immunoreactive, h. Mesenchymal, and i. Proliferative OV subtypes, Log-rank Test.
