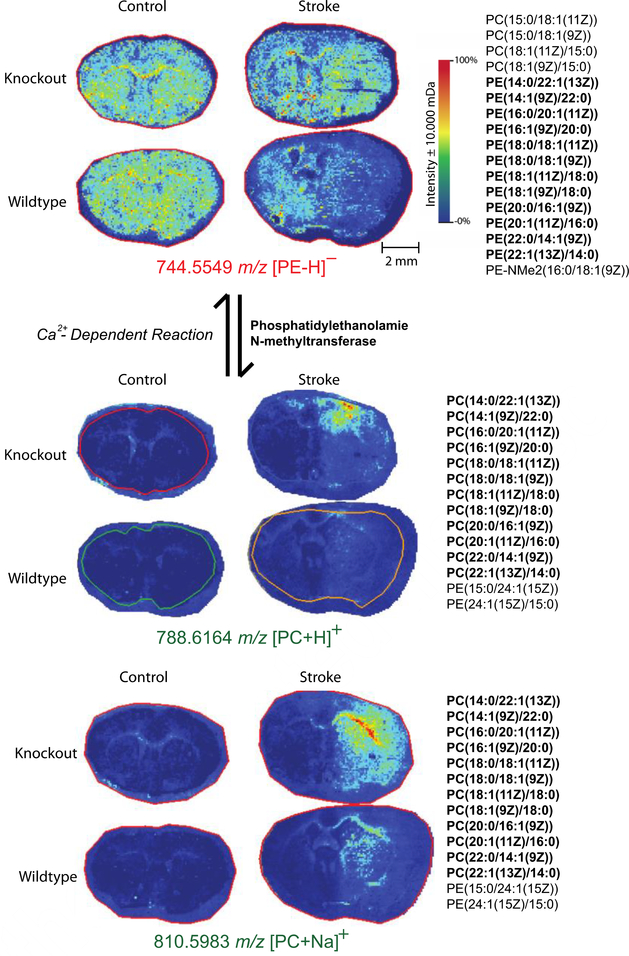
Figure 5.
MALDI MSI heat maps for phosphatidylethanolamine and phosphatidylcholine for lipids with identical side chains. Both PE and PC species appear to be more abundant in knockout mouse models than wild type mouse models. Possible identifications for each m/z are listed to the right of the ion heat maps. MALDI MSI analysis was conducted using a 15T FT-ICR mass spectrometer with a mass window of ±10 mDa. Mass-to-charge ratios in green indicate that samples were acquired in positive mode, while red indicates negative mode. Ion intensity bar and scale bar are displayed in the top panel

