
Fig. 8.
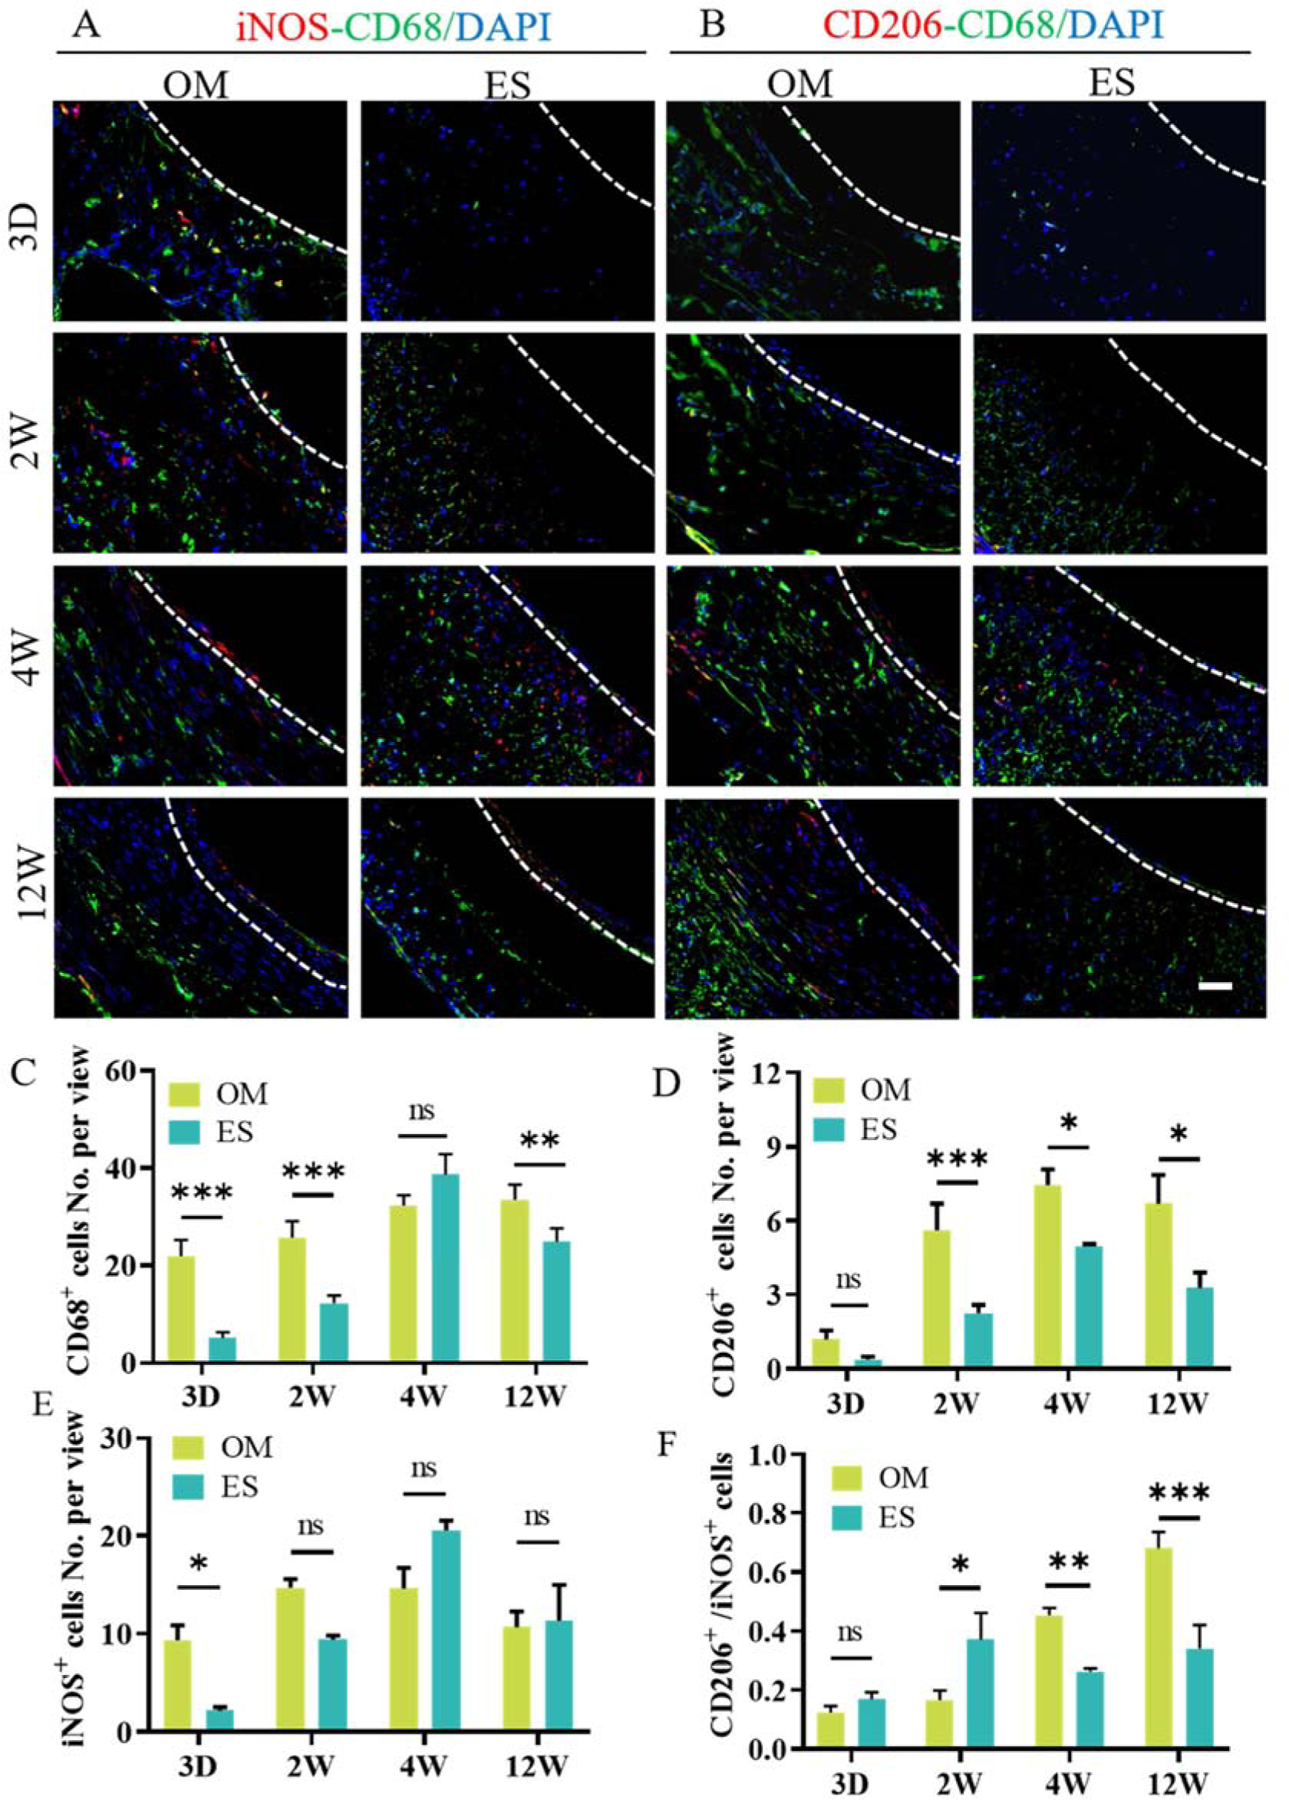
Macrophages infiltration and polarization. A, B: Representative images of immunofluorescence co-staining with the CD68 (green)-iNOS (red) and CD68 (green)-CD206 (red) antibody. C, D, and E: Quantification of the number of CD68+ cells, CD206+ cells, and iNOS+ cells. F: The ratio of CD206+ to iNOS+ cells. Nuclei were counterstained by DAPI (blue). 3D, 2W, 4W and 12W mean 3 days, 2 weeks, 4 weeks and 12 weeks, respectively. The white dashed line indicates the interface between scaffold and the neointima. Data are represented as the mean ± SEM for each group. *:˖p < 0.05; **: p < 0.01; ***: p < 0.001, n = 6, two-way-ANOVA followed by Tukey’s post hoc analysis. Scale bar: 50 μm.