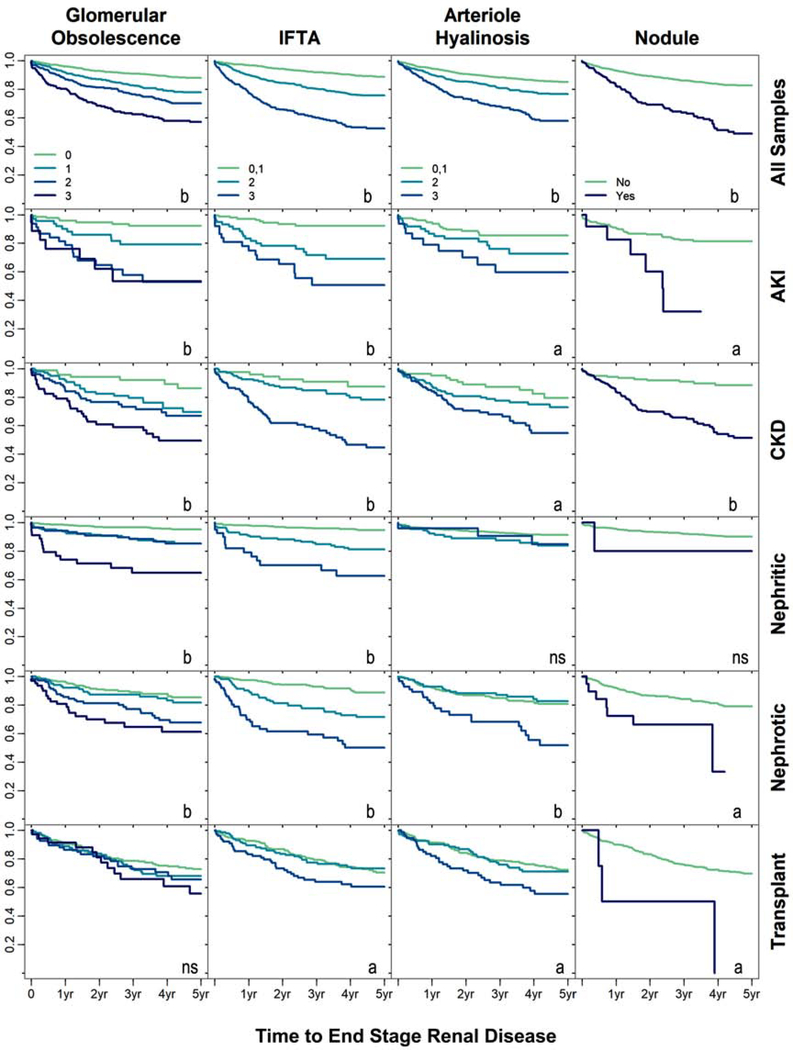
Figure 1:
Kaplan-Meier curves are depicted for the relationship between five histopathologic variables with incident ESRD across the entire cohort (row 1) and in sub-group analyses (rows 2–6). All curves are depicted as unadjusted. Unadjusted significance at P < 0.05 is acknowledged by “a” and significance at P < 0.001 by “b”. For glomerular obsolescence, comparisons were made to samples with ≤ 10% obsolescence (0). For interstitial fibrosis and tubular atrophy (IFTA) and hyaline arteriolosclerosis, comparisons were made to the combined “none” and “mild” groups (0,1). Sub-groups were categorized based on their primary pathologic diagnosis as assigned by a pathologist. AKI – acute kidney injury, CKD – chronic kidney disease, nephritic – nephritic syndrome, nephrotic – nephrotic syndrome, transplant – transplant-related diagnosis.

