Abstract
N6-methyladenosine (m6A) plays important roles in regulating mRNA processing. Despite rapid progress in this field, little is known about genetic determinants of m6A modification and their role in common diseases. In this work, we mapped quantitative trait loci (QTLs) of m6A peaks in 60 Yoruba lymphoblast cell lines (LCLs). We find that m6A-QTLs are largely independent of expression and splicing QTLs, and are enriched with binding sites of RNA-binding proteins (RBPs), RNA structure-changing variants and transcriptional features. Joint analysis of QTLs of m6A and related molecular traits suggests that downstream effects of m6A are heterogeneous and context-dependent. We identified proteins that mediate m6A effects on translation. Integrating with data from genome-wide association studies (GWAS), we show that m6A-QTLs contribute to heritability of various immune and blood-related traits at levels comparable to splicing-QTLs and roughly half of eQTLs. Leveraging m6A-QTLs in a transcriptome-wide association study (TWAS) framework, we identified putative risk genes of these traits.
Introduction
The m6A modification plays a critical role in many regulatory processes1,2, including pre-mRNA processing3–5, mRNA export6, mRNA stability7 and translation efficiency8–12. Levels of m6A are controlled by both m6A writers – in particular the METTL3/14 complex13,14 – and erasers, such as ALKBH515 and FTO16,17. The downstream functions of m6A are mediated by reader proteins that recognize m6A and regulate mRNA processing. These m6A-mediated regulatory pathways affect many biological processes, such as development, stress response, immune, and neuronal functions2,18.
Despite rapid progress, our understanding of m6A regulation and function has notable gaps. Among all adenosine sites on mRNA, only a small fraction are m6A-modified and we know little about what controls this specificity. While some m6A reader proteins have been characterized in detail3,6–8,11,12,19,20, we have limited understanding of how RNA sequence contexts may affect recognition of m6A by readers and downstream effects. At the phenotypic level, dysregulation of m6A has been implicated in cancer progression21–26. However, we know little about whether m6A variation contributes to other common diseases.
To fill these gaps, we took a genetic approach based on mapping variants associated with m6A levels in mRNA transcripts, or m6A-QTLs. QTL mapping of molecular traits has provided unique insights into gene regulation27–36. Molecular QTLs, especially expression QTLs (eQTLs), are enriched with human disease-associated variants, and can be leveraged to identify susceptibility variants and genes37–40.
We mapped m6A-QTLs using LCLs, for which QTL data of multiple molecular traits are available27–36. We found that the m6A consensus motif (RRACH), while highly enriched, explains only a small fraction of m6A-QTLs. We observed that m6A-QTLs are enriched in RBP target sites, RiboSNitches (variants affecting RNA secondary structure) and transcriptional features, suggesting that these factors are important regulators of m6A installation. By integrating with other molecular QTL data, we found that regulatory effects of m6A on downstream traits such as translation likely vary across m6A sites in a context-dependent manner.
We conducted joint analysis of m6A-QTLs and GWAS data. Current efforts to characterize GWAS variants have largely focused on transcriptional effects. However, recent studies, employing different approaches from colocalization to heritability analyses, estimate that eQTLs explain only 10–25% of GWAS signals37,40,41. To fill this gap, researches have suggested other mechanisms such as RNA splicing42,43. In our analysis, we found that m6A-QTLs are enriched for risk variants of a range of complex traits, particularly autoimmune diseases and blood-cell-related traits. The contribution of m6A-QTLs to heritability of these traits is roughly half of eQTLs and comparable to splicing-QTLs (sQTLs). Treating m6A level as molecular traits, we performed a TWAS of these traits and identified a number of m6A sites and related genes. Taken together, our results demonstrate that m6A variation is an important link between genetic and phenotypic variation.
Results
Mapping cis-m6A-QTLs.
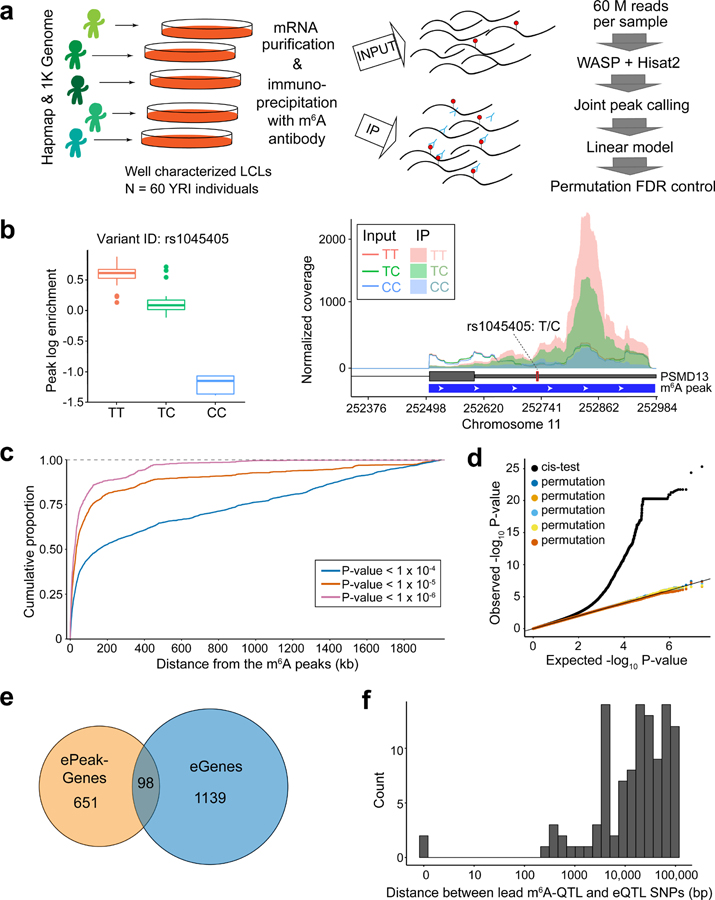
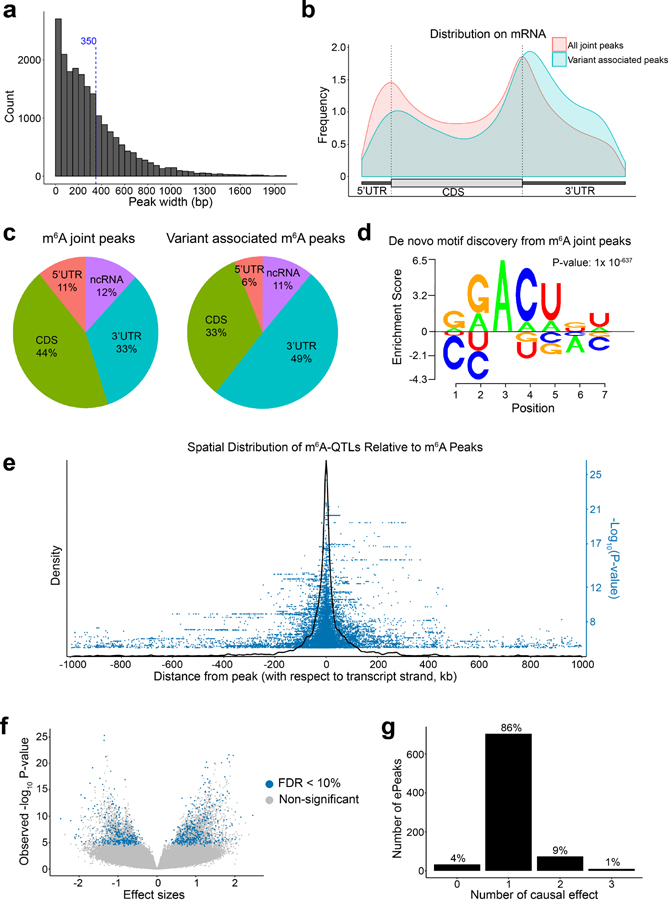
We used m6A-seq44,45 to profile m6A levels across the transcriptome in LCLs derived from 60 Yoruba individuals. We obtained on average 60 million reads for unmodified (input) and immunoprecipitated (IP) mRNA libraries for each cell (Fig. 1a). We called peaks jointly on all samples (see Methods), and identified 20,044 peaks (Supplementary Table 1) located in transcripts of 8,448 genes, with an average peak length of 351 bp (Extended Data Fig. 1a). Consistent with previous reports44,45, m6A peaks are enriched near start and stop codons (Extended Data Fig. 1b, c) and sequences within peaks are enriched of the RRACH motif (Extended Data Fig. 1d).
Fig. 1: Mapping common genetic variants associated with m6A.
a, Overall study design and workflow of m6A-QTL mapping. The linear regression model for association testing, adjusting for GC content and IP efficiency. b, An example of m6A-QTL. The left panel shows the box plot of m6A levels grouped by the genotypes of the example m6A-QTL (rs1045405). n = 60 biologically independent samples. The lower and upper hinges correspond to the first and third quartiles. Horizontal line indicates median value, and whiskers correspond to the value no further than 1.5× inter-quartile range. The right panel shows the mean coverage of each genotype at the m6A peak. The m6A peak is shown by the blue track and the gene model by the gray track. The coverages of input and IP libraries are shown in lines and shadows, respectively. c, Spatial distribution of m6A-QTLs represented by cumulative fraction of SNPs with increasing distance from m6A peaks at varying P value cutoffs of SNP-peak association. d, Quantile-quantile (QQ) plot of P values. cis tests (n = 60 individuals) results are plotted in black and results of five permutation tests are shown in different colors. e, Overlap between ePeak-harboring genes and eGenes (both at FDR < 10%) mapped in the same cohort of YRI LCL samples. f, Distribution of the distance between the lead ePeak SNP and the eGene SNP in genes that have both ePeak and eGene mapped.
We tested association between m6A level of each peak and nearby genetic variants using a linear model, accounting for GC content and other covariates (Fig. 1b, see Methods and Supplementary Note). To determine a proper window size for cis-QTL mapping, we first tested all single-nucleotide polymorphisms (SNPs) within 2 Mb of m6A peaks (Extended Data Fig. 1e). Most SNPs strongly associated with m6A are within 100 kb of m6A peaks (Fig. 1c). We therefore restrict our cis-tests to SNP-peak pairs within 100 kb. The resulting P values show a strong deviation from the null expectation, while P values from permutations are consistent with null, indicating that the test is well-calibrated (Fig. 1d). We used a permutation scheme implemented in FastQTL46 to account for multiple genetic variants tested per peak. This results in 822 peaks with at least one significant cis-m6A-QTL (denoted as ePeaks, following the literature of eQTLs), at 10% FDR47 (Extended Data Fig. 1f). Most of these ePeaks (86%) have single causal effect (Extended Data Fig. 1g), based on computational fine-mapping analysis48.
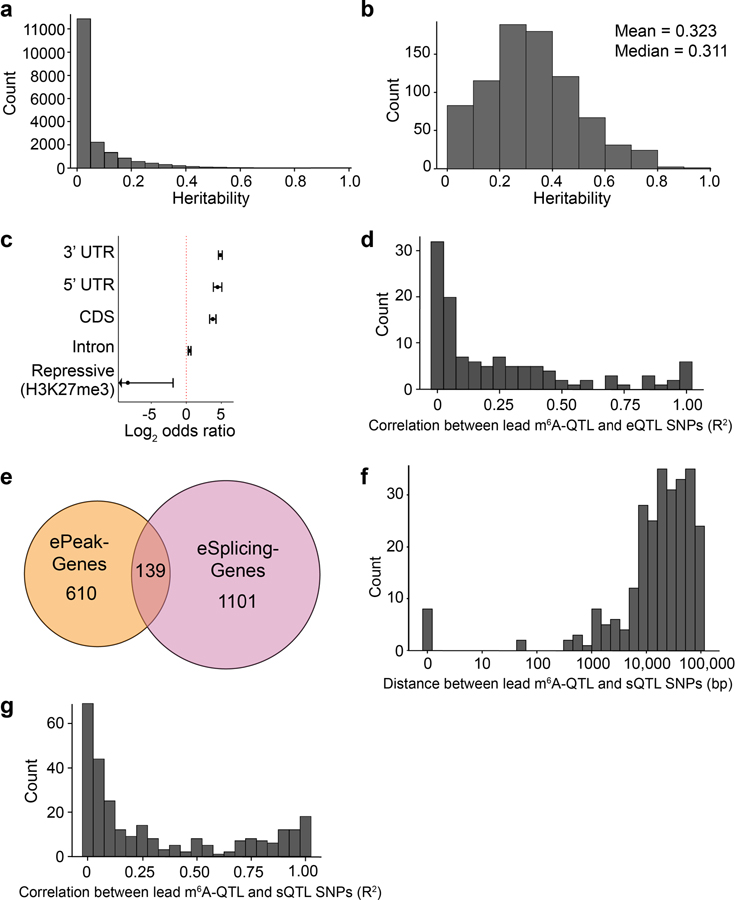
We quantified the contribution of genetic variation to inter-individual variation of m6A levels by estimating the cis-heritability of each peak. Most peaks have low heritability values, with 918 peaks having heritability > 0 (Extended Data Fig. 2a). Heritability of ePeaks is higher with median 0.31 (Extended Data Fig. 2b).
We next examined the distribution of m6A-QTLs relative to gene-based features, using the program Torus39,49. m6A-QTLs are most enriched in 3’ UTR (log2 odds ratio = 4.9, log2OR hereafter) followed by 5’ UTR (log2OR = 4.5) and CDS (log2OR = 3.8), but not in intergenic repressive regions as marked by H3K27me3 (Extended Data Fig. 2c).
Comparing m6A-QTLs to eQTLs mapped in the same LCLs, we find that genes containing ePeaks and eQTLs are largely distinct (Fig. 1e). In genes with both m6A- and expression QTLs, lead SNPs of two types of QTLs are mostly > 10 kb apart and in low linkage disequilibrium (LD) (Fig. 1f, Extended Data Fig. 2d). Comparison of m6A-QTLs to sQTLs shows similar patterns (Extended Data Fig. 2e–g). These results suggest that m6A-QTLs and eQTLs/sQTLs are distinct types of molecular QTLs.
m6A-QTLs are enriched in RNA-related features.
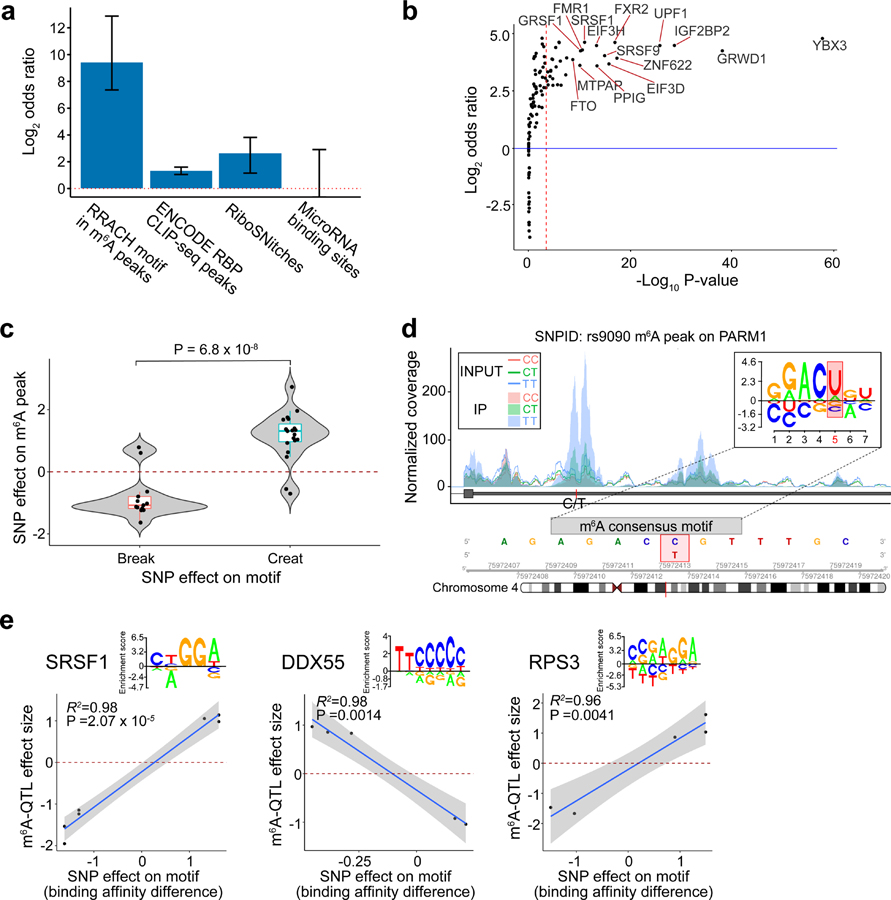
To understand which factors may determine m6A deposition, we analyzed features of m6A-QTLs and their surrounding sequences. We annotated SNPs using RNA-related features including m6A consensus motif (RRACH) contained in m6A peaks, binding sites of 121 RBPs (ENCODE eCLIP-seq peaks50), RiboSNitches51 (genetic variants changing RNA secondary structure), and predicted microRNA binding sites52. We used two approaches to test enrichment. In our primary analysis, we used Fisher’s exact test, comparing possible causal variants of m6A from fine-mapping48 and randomly sampled SNPs that match key properties of m6A-QTLs (see Methods)53. We find m6A consensus motif in m6A peaks highly enriched in m6A-QTLs with odds ratio (OR) of 685 (P = 1.0 × 10⁻³³). However, only 12% of m6A-QTLs contained in m6A peaks (most QTLs are outside peaks) disrupt the consensus motif. Despite of this, we find m6A-QTLs tend to locate in proximity to the consensus motif as additional 33% of m6A-QTLs contained in m6A peaks are located within 50 bp of the motif and 46% within 100 bp, suggesting many m6A-QTLs may indirectly affect binding of the methyltransferase, demethylase or reader proteins to the consensus motif. We also find enrichment in RiboSNitches (OR = 6.2, P = 5.9 × 10⁻⁴) and RBP binding sites (OR = 2.5, P = 8.3 × 10⁻¹⁹) but not predicted microRNA targets52 (Fig. 2a). As a secondary analysis, we tested enrichment using Torus, which accounts for uncertainty of causal variants due to LD. This analysis reveals similar results (Extended Data Fig. 3a).
Fig. 2: Functional features enriched in m6A-QTLs.
a, Log2 odds ratio enrichment of fine-mapped m6A-QTLs (SNP with the highest posterior inclusion probability, or PIP, in each credible set) vs. random control SNPs (see Methods) in RNA features by Fisher’s exact test. Error bars represent 95% confidence intervals from two-tailed tests. b, Enrichment of m6A-QTLs in RNA binding protein (RBP) binding sites of individual RBPs using eCLIP-seq data from ENCODE50 by Torus39,49. The red dashed line represents the Bonferroni-corrected P value 0.05 threshold. c, Distribution of m6A-QTL effect sizes between SNPs creating vs. breaking the m6A consensus motif. P value was computed using Welch’s test (n = 32 SNPs). The lower and upper hinges correspond to the first and third quartiles. Horizontal line indicates median value, and whiskers correspond to the value no further than 1.5× inter-quartile range. d, An m6A-QTL example illustrating how a genetic variant disrupting a RRACH motif could lead to m6A variation. e, RBPs for which changes in binding affinities are significantly correlated with fine-mapped m6A-QTL effect sizes (all SNPs with PIP > 0.5, and maximum PIP SNPs for ePeaks without SNP PIP > 0.5). Changes in binding affinity are represented by the alteration of motif match scores from the reference to alternative allele. Shaded region and line show the 95% confidence interval and fitted line from the linear model (n = 7, 5 and 5 SNPs for SRSF1, DDX55 and RPS3, respectively).
We tested enrichment for each RBP and microRNA separately using Torus (Supplementary Table 2). Interestingly, several of the most enriched RBPs are known m6A-interacting proteins including FTO, an m6A demethylase16,17, and IGF2BP2, an m6A reader protein that stabilizes nuclear RNA19 (Fig. 2b). Analyses of individual microRNAs show enrichment of m6A-QTLs in binding sites of hsa-miR-582–5p and hsa-miR-331–3p. This finding is in line with previous reports that microRNA could affect m6A levels54.
The enrichment of binding sites of an RBP in m6A-QTLs could occur if binding sites of an RBP co-occur with cis-elements regulating m6A, without the RBP playing a direct role in m6A deposition. We reason that if the RBP is causal, alterations in motif scores (disruption or creation) of SNPs should be correlated with their effects on m6A deposition. We limited this correlation analysis to fine-mapped m6A-QTLs that also have significant effects on motif score. As a proof of principle, DNA variants creating a consensus motif are much more likely to be positively associated with m6A levels (Fig. 2c, an example in Fig. 2d). We tested 29 RBPs with > 5 data points, and identified three RBPs with significant correlations at FDR 10% (Fig. 2e). Interestingly, SRSF1 is a known splicing factor55, suggesting a possible connection of splicing with m6A deposition.
m6A modification is coupled with transcriptional processes.
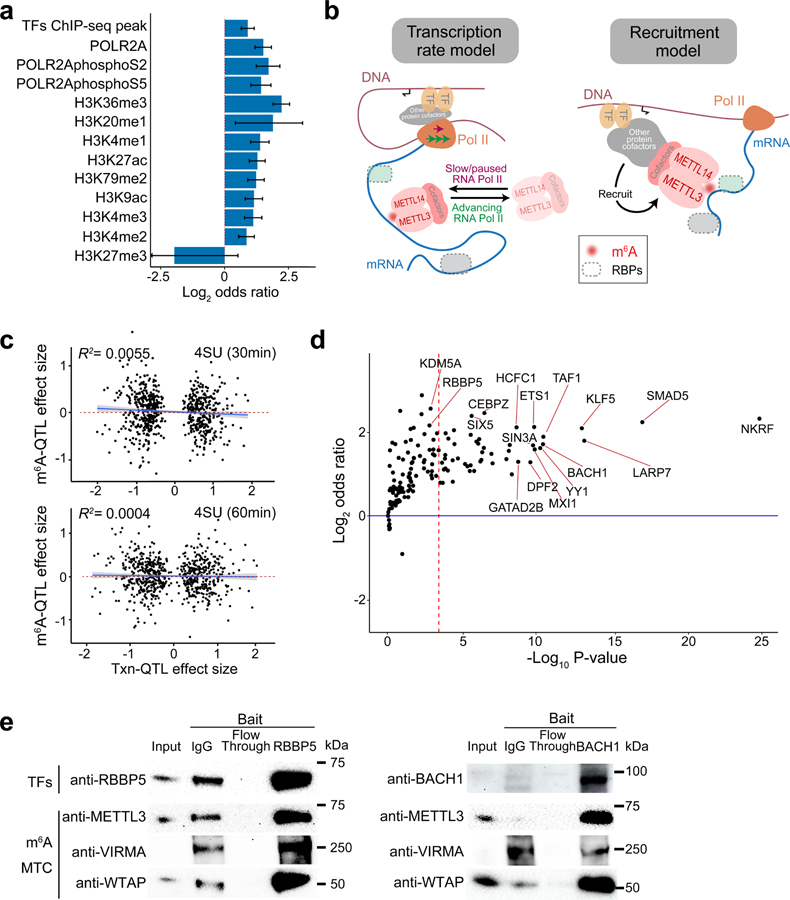
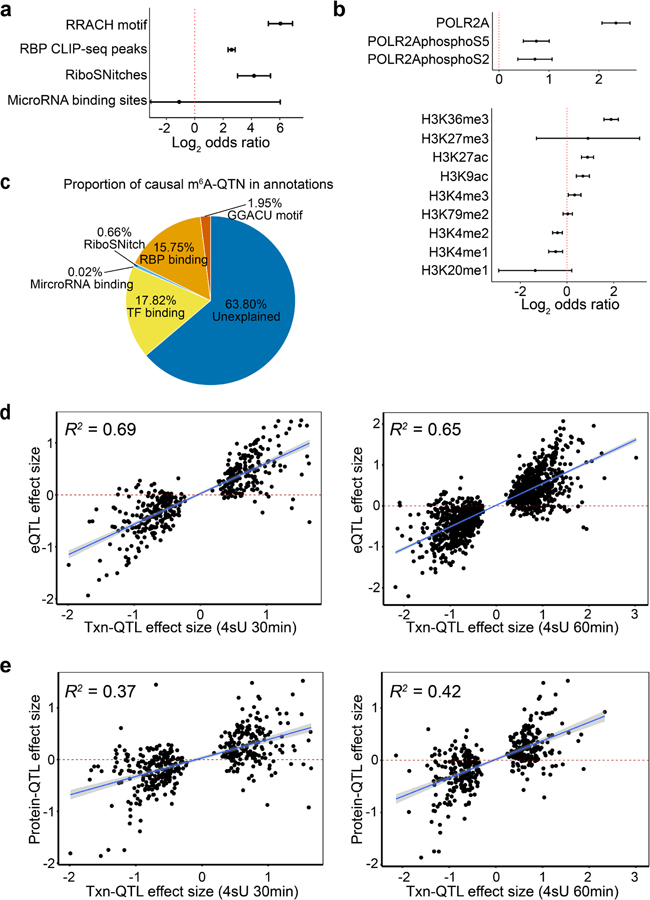
Recent studies suggest that the deposition of m6A may occur co-transcriptionally and be influenced by transcription processes56–58. We used our m6A-QTLs and ENCODE ChIP-seq data from LCLs to examine the link between m6A and transcription32,59. We observed significant enrichment (Fisher’s exact test) of fine-mapped m6A-QTLs in RNAPII, phospho-RNAPII and transcription factor binding sites (TFBSs) as well as in histone marks of promoters (H3K4me3), enhancers (H3K4me1, H3K27ac) and active transcription (H3K36me3) (Fig. 3a). The enrichment of m6A-QTLs in H3K36me3, the most enriched feature, remains strong when conditioned on other histone modifications using Torus (Extended Data Fig. 3b). H3K36me3 was shown by a recent study60 to be recognized by the m6A writer protein METTL14 to facilitate m6A installation on mRNA, thus validating our finding.
Fig. 3: m6A installation is coupled with transcriptional processes.
a, Enrichment of fine-mapped m6A-QTLs (SNP with the highest posterior inclusion probability, or PIP, in each credible set) in chromatin features by the two-sided Fisher’s exact test comparing m6A-QTLs to control SNPs. The error bars represent 95% confidence intervals. b, Two possible models of m6A regulation through transcription. c, Effect sizes of ascertained transcription rate QTLs (Txn-QTLs) vs. their effects on m6A level. The transcription rate was measured by 4sU-seq in an earlier study43. 4sU-seq of 30 mins 4sU labeling (upper, n = 698 SNPs) and 60 mins 4sU labeling (lower, n = 688 SNPs) showed similar results. Shaded region and line show the 95% confidence interval and fitted line from the linear model. d, Enrichment of m6A-QTL in transcription factor (TF) binding sites of individual TFs conditioned on H3K27ac peaks by Torus analysis. The red dashed line shows the Bonferroni-corrected P value 0.05 cutoff. e, Western blot of transcription factor (TF) co-IP experiment. 10% of lysate was loaded as “input”. The cropped blot of each TF of interest is shown, as well as three m6A methyltransferase complex components—METTL3, WTAP and VIRMA. These experiments were repeated twice with similar results.
We then compared contributions of RNA-related and transcriptional features (TFBSs) to m6A-QTLs. We used fine-mapping to quantify the probability of a SNP being a causal variant of m6A, known as Posterior Inclusion Probabilities (PIPs). We estimated the proportion of causal variants attributed to a feature by summing the PIPs of all variants located within that feature (see Methods). Using this approach, we find that TFBSs and RBP binding sites make about equal contribution to m6A-QTLs (17.8% and 15.8%, respectively) and RRACH motif contributes 1.95% (Extended Data Fig. 3c).
These findings support a tight connection between transcriptional processes and m6A installation. Two models have been suggested to explain this connection (Fig. 3b). In the first model (“transcription rate model”), m6A installation is affected by the progression rate of RNAPII, with fast progression associated with lower m6A methylation57. In the second model (“TF recruitment model”), the methyltransferase complex is recruited to mRNA by TFs, e.g. ZFP21758, CEBPZ23 or adaptor proteins, e.g. SMAD2/356.
If the transcription rate model is correct, we expect correlation between variant effects on transcription rate and variant effects on m6A level in the matched transcript. To assess this, we ascertained the lead SNPs of transcription-rate-QTLs from the same LCL samples43, but find little correlation between transcription rates and m6A effect sizes (Fig. 3c). As a positive control, we observed strong correlation of transcription-rate-QTL effects with eQTL effects (R2 = 0.69 and 0.65) and with protein-QTL effects (R2 = 0.37 and 0.42) in the matched transcripts (Extended Data Fig. 3d, 3e). These data suggest that overall transcription rate may not determine m6A deposition in LCLs. It remains possible that other mechanisms such as RNAPII pausing explain the observed correlation between m6A and transcription rates in an earlier study57.
To examine the TF recruitment model, we used Torus to assess enrichment of m6A-QTLs for binding sites of individual TF while accounting for enrichment of m6A-QTLs in H3K27ac, a general transcription marker. 50 TFs are significantly enriched at Bonferroni-corrected P value < 0.05 (Fig. 3d, Supplementary Table 2). We then selected a few of these based on literature review and performed co-immunoprecipitation (co-IP) experiments. Two TFs robustly pull down m6A methyltransferase components in LCLs, including RBBP5, a component of COMPASS histone H3K4 methylase complex, and BACH1, a regulator of oxidative stress61,62 (Fig. 3e, Source Data Fig. 3e), supporting the “TF recruitment model”.
Analysis of molecular QTLs suggests context-dependent effects of m6A.
It is generally believed that specific reader proteins recognize m6A and mediate downstream effects1,2. The best-studied readers are known to promote translation (e.g. YTHDF1), mRNA degradation (e.g. YTHDF2), or affect mRNA nuclear processing (e.g. YTHDC1)3,6–8. We use m6A-QTLs as natural perturbations of m6A to explore its effects on five possible downstream traits: mRNA expression, ribosome binding, protein level, mRNA decay rate and alternative polyadenylation (APA)29,33,36,43.
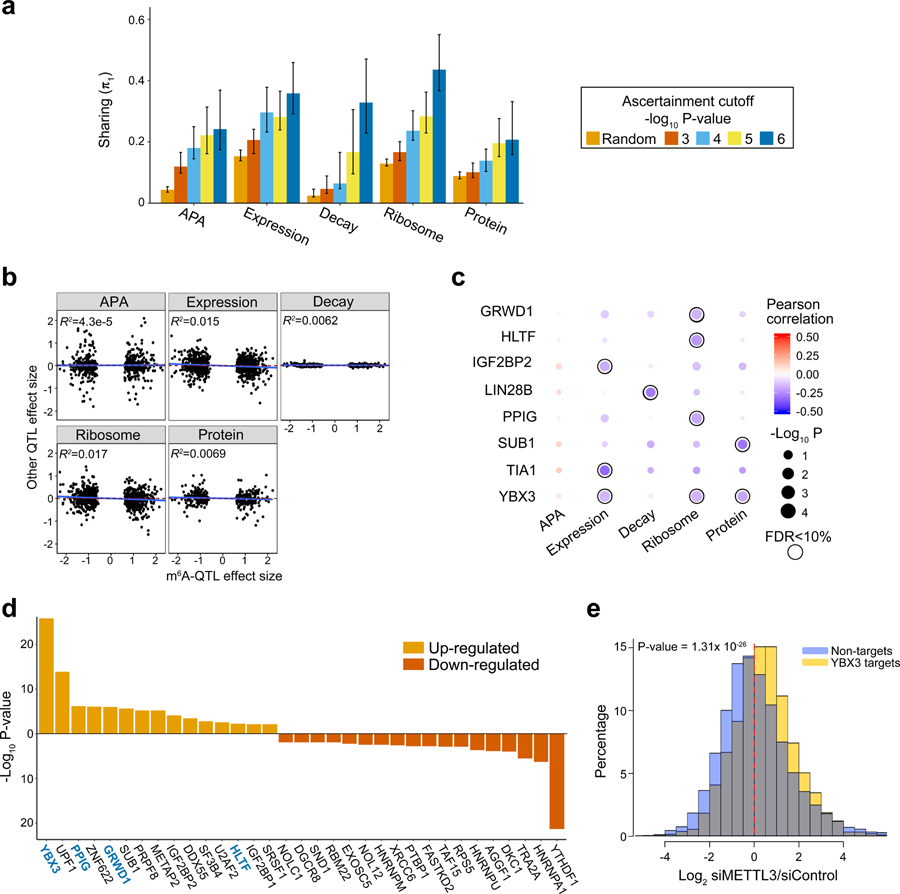
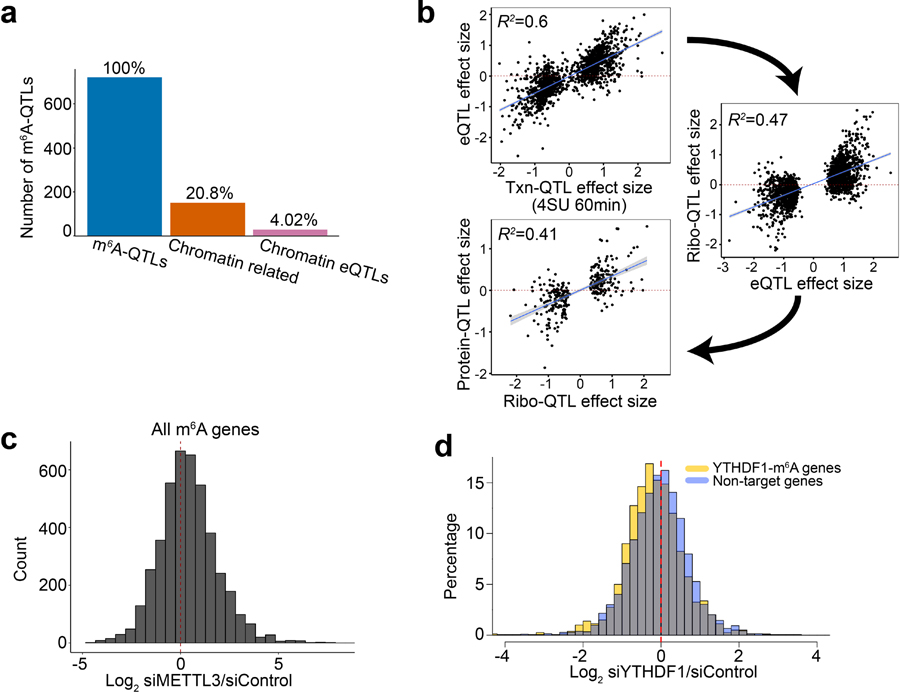
We first ascertained lead m6A-QTLs at different P value thresholds, and then estimated the percentage of m6A-QTLs that are also QTLs of other traits using Storey’s π1 method43,47. We find m6A-QTLs are more likely to be other QTLs than random SNP-gene pairs, with increased sharing at more stringent P value threshold (Fig. 4a), suggesting functional connections between m6A and other molecular phenotypes, as expected from earlier studies1,2. The π1 values are generally lower than those between QTLs along the cascade from transcription to protein43. One potential problem is that sharing of m6A-QTLs and other molecular QTLs may be confounded by eQTLs, as transcription may influence both m6A and other traits. However, the majority of m6A-QTLs are not chromatin-associated eQTLs, suggesting that in practice, this is not a large concern (Extended Data Fig. 4a).
Fig. 4: Joint analysis of m6A-QTLs and other molecular QTLs.
a, The estimated fractions of m6A-QTLs shared with other molecular phenotypes, measured by π1, the fraction of true positives. The five bars in each panel correspond to random SNPs and m6A-QTLs at different P value cutoffs. Error bars show 80% confidence intervals (n = 100 bootstraps). b, Low correlations of effect sizes between m6A-QTLs and related molecular QTLs, estimated from linear regression (n = 709, 884, 742, 884 and 393 SNPs-gene pairs for APA, Expression, Decay, Ribosome and Protein, respectively). c, Correlations of effect sizes between m6A-QTLs and related molecular traits QTLs stratified by the m6A sites bound by different RBPs. Correlations are determined by linear regression. Shown are RBPs having at least one trait significantly correlated trait with m6A at FDR < 10%. Pearson correlations are shown by color code and P value by dot size. d, RNA binding proteins (RBPs) that modulate the impact of m6A depletion on translation efficiency. For each RBP, Welch’s two-sided t test is used to test the log2 fold-change in translation efficiency in RBP targets vs. non-targets, upon METTL3 knockdown (n = 11,412 transcripts). RBP targets are defined by transcripts harboring m6A peaks that are bound by certain RBP. Shown are RBPs with FDR < 5% (Benjamini & Hochberg method). RBPs with significant correlation between m6A-QTL and ribosome-QTL effect sizes are highlighted in blue. e, Distribution of log2 fold-change in translation efficiency of YBX3 targets, upon m6A (METTL3) depletion, in comparison with non-targets. P value is computed by Welch’s two-sided t test (n = 11,412 transcripts).
Based on our current understanding that m6A function is mediated by reader proteins with certain downstream effects (e.g. increase of translation efficiency by YTHDF1), we hypothesize that m6A-QTLs and other molecular QTLs have consistent effect directions. To test this hypothesis, we first confirmed that molecular traits along the cascade from transcription to translation show high positive correlations in QTL effects (Extended Data Fig. 4b). Surprisingly, the effect sizes of m6A-QTLs and other molecular traits are poorly correlated (Fig. 4b). This lack of overall correlation suggests that effects of m6A on downstream molecular phenotypes may be heterogeneous, with mechanisms varying across transcripts.
The context dependency of m6A function may be partially mediated by RBPs bound near m6A peaks. For example, binding by different m6A readers may lead to different downstream effects. To examine this hypothesis, we stratified our effect size correlation analysis by m6A peaks bound by different RBPs (using eCLIP-seq data). In 8 RBPs, we observed significant correlations (FDR < 10%) between effect sizes of m6A-QTLs and at least one related molecular trait (Fig. 4c). This result suggests that m6A function may vary according to binding of specific RBPs.
m6A affects translation efficiency in a context-dependent manner.
To further investigate context-dependent effects of m6A, we made use of data from an earlier study8 of m6A effects on translation in HeLa cells. This study examined the impacts of m6A depletion (by METTL3 knockdown) and YTHDF1 (m6A reader) knockdown on translation efficiency (TE) of all transcripts, measured by ribosome profiling. Across all m6A modified transcripts, the effects of m6A depletion on TE are heterogeneous, with similar numbers of up- and down-regulated genes (Extended Data Fig. 4c). To assess the impact of RBP context, we compared the effects of m6A depletion on TE of transcripts containing m6A sites targeted by an RBP vs. transcripts not targeted. Among 121 tested RBPs, 33 showed statistically significant differences in target sites vs. non-targets (FDR < 5%) (Fig. 4d). Again, the effects are quite heterogeneous with almost equal numbers of RBPs involved in up- and down-regulation of TE upon m6A depletion. This list includes all four RBPs (YBX3, GRWD1, HLTF and PPIG) we identified from m6A vs. ribosome QTL effect correlation analysis (Fig. 4c). Furthermore, the effect directions were consistent between two studies: m6A depletion resulted in higher TE of the RBP’s targets, in agreement with negative correlations of m6A versus ribosome QTL effects (Fig. 4c and 4d). These results provide independent support to the hypothesis that the effects of m6A on TE depend on contexts, in particular binding of specific RBPs.
Interestingly, even in transcripts targeted by the classical m6A reader, YTHDF1, the effect of m6A may be more complex than previously thought. While depletion of YTHDF1 leads to an overall reduction of TE in transcripts harboring YTHDF1-bound m6A peaks, ~33% YTHDF1 targets show opposite effects (Extended Data Fig. 4d). This observation suggests the possibility that the action of reader proteins may be modulated by additional, yet-to-identify factors, diversifying m6A effects.
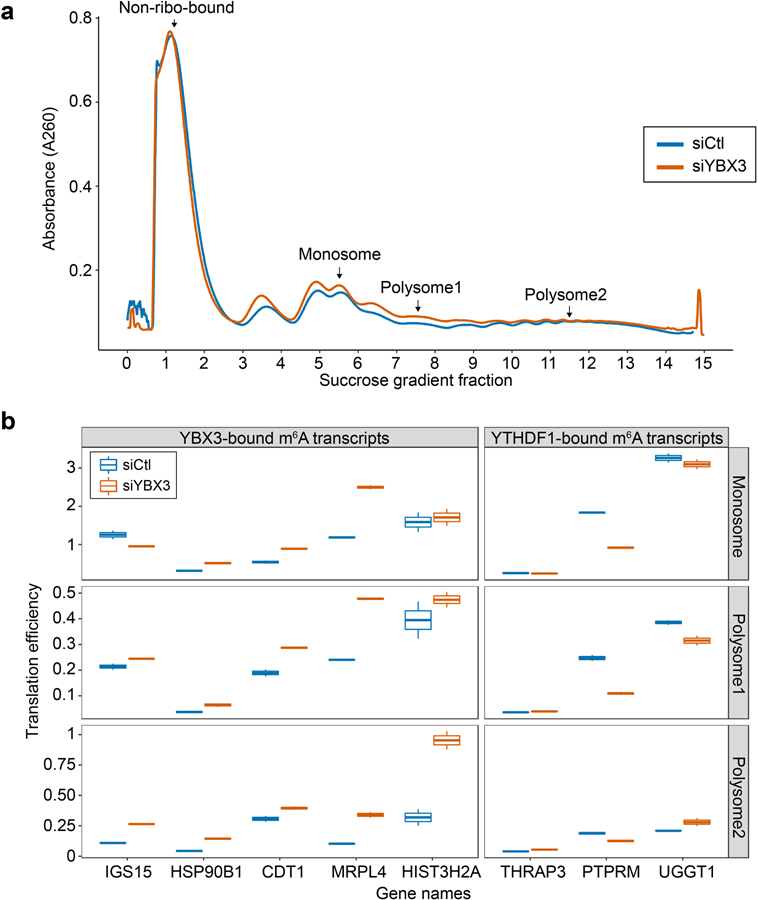
We validated an m6A effector protein, YBX3, as a translation repressor of m6A-modified and YBX3-bound transcripts (Fig. 4e). We knocked down YBX3 in HeLa cells and performed polysome profiling followed by RT-qPCR. We find more RNAs in polysome-bound fractions in YBX3-depleted cells compared with control (Extended Data Fig. 5a), suggesting YBX3 as a translation repressor. To further validate YBX3 function, we selected five transcripts harboring m6A peaks overlapping with YBX3-bound sites, all of which show elevated TE upon METTL3 knockdown (Fig. 4e). We quantified these transcripts in three polysome-bound fractions using RT-qPCR upon YBX3 knockdown. TE of these target transcripts is elevated in YBX3-depleted cells compared with control in all but one case (Extended Data Fig. 5b). As a negative control, three YTHDF1-targeted m6A transcripts do not show TE elevation upon YBX3 depletion. These results suggest that YBX3 likely mediates m6A effect by repressing translation of YBX3-bound m6A transcripts. This effect is opposite of YTHDF1’s effect (increasing translation), providing a partial explanation of why m6A downstream effects appear heterogeneous (Fig. 4b, d).
m6A-QTLs make a significant contribution to the genetics of complex traits.
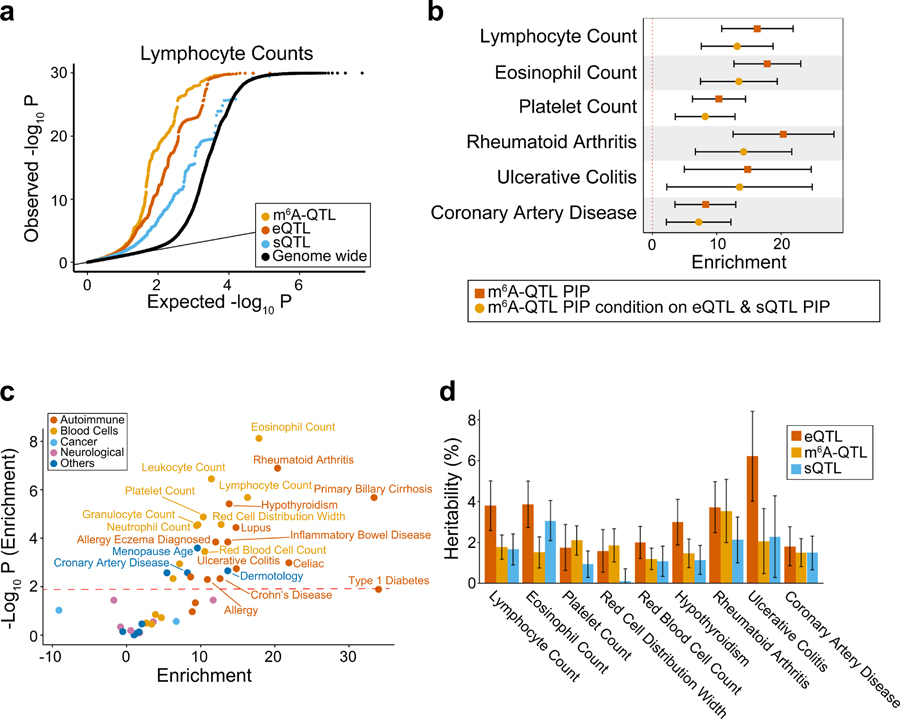
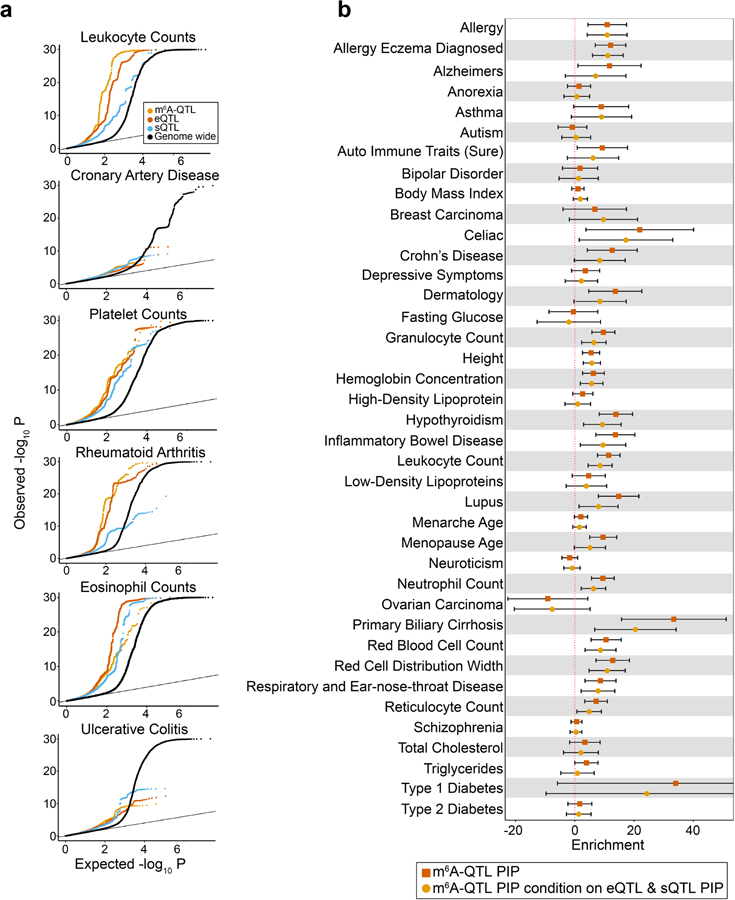
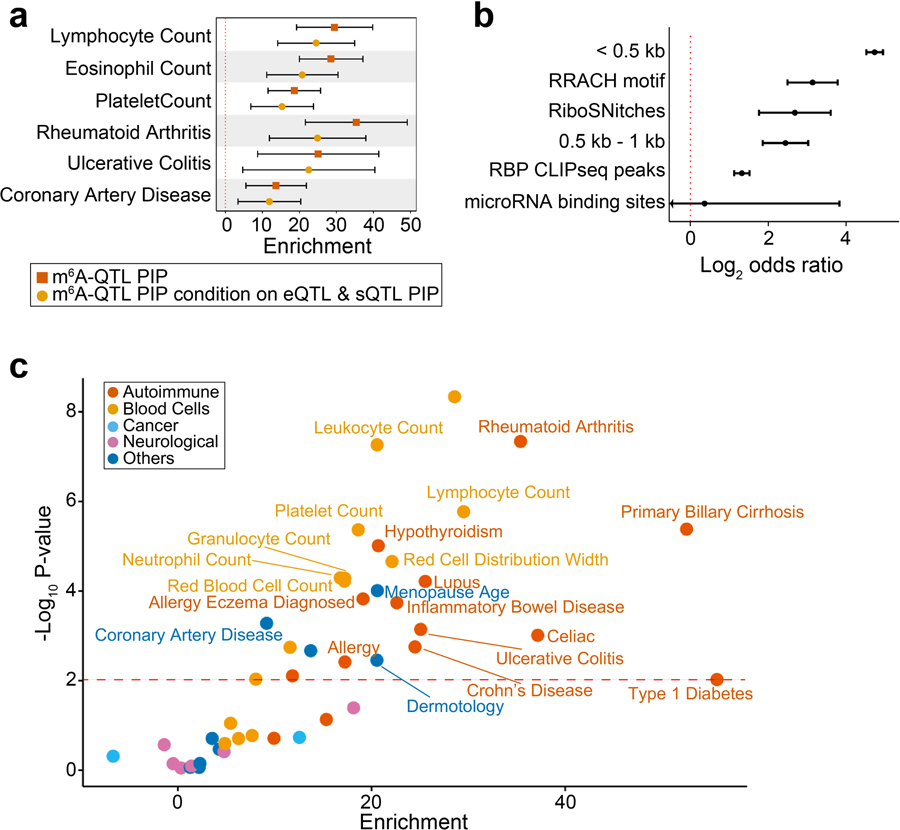
To study the role of m6A-QTLs in human phenotypic variation, we collected GWAS summary statistics of 45 complex traits with an emphasis on immune and blood-related traits. For comparison, we also included eQTLs and splicing QTLs (sQTLs) from LCLs. All three types of QTLs show excess of low P values in GWAS of these traits, e.g. lymphocyte counts (Fig. 5a, Extended Data Fig. 6a). We used Stratified LD score regression (S-LDSC)41,63,64 to formally test enrichment of GWAS variants in m6A-QTLs. S-LDSC is a tool for assessing how the heritability of a complex trait is partitioned among functional features, while controlling for LD, allele frequency and other baseline features. Following a previously used strategy37,40, we fine-mapped m6A-QTLs48 and used the resulting PIPs as an annotation, representing likely causal m6A variants (known as Quantitative Trait Nucleotides, or QTNs). We find 10- to 20-fold enrichment of heritability in m6A-QTNs in several selected traits (Fig. 5b, Extended Data Fig. 6b). The enrichment increases to 15- to 35-fold (Extended Data Fig. 7a), when we used m6A-related annotations (Extended Data Fig. 7b), such as RBP binding, as priors to improve fine-mapping (see Methods). Including QTNs of expression and splicing in S-LDSC only modestly reduced the enrichment level (Fig. 5b). We note, however, that m6A may affect expression (e.g. by changing mRNA stability) and pre-mRNA splicing, therefore adjusting eQTLs and sQTLs likely leads to underestimation of m6A-QTL enrichment. Expanding S-LDSC analysis to all 45 traits, we find that m6A-PIPs are enriched in most immune and blood traits (Fig. 5c, Extended Data Fig. 7c), and a small number of other traits such as Coronary Artery Disease (CAD) and age at menopause, in which immune systems may play a significant role65–67. These results thus support the specificity of our finding, and are consistent with the known role of m6A in the immune system68–71.
Fig. 5: Integrated analysis of m6A-QTLs and GWAS data of human complex traits.
a, Quantile-quantile (QQ) plot of lymphocyte count GWAS P values. m6A-QTLs, eQTLs and sQTLs are shown in comparison with genome wide SNPs. GWAS SNPs are binary annotated using m6A-QTLs, eQTLs and sQTLs with P value < 1 × 10⁻⁴. b, Enrichment of selected immune and blood GWAS trait heritability estimated by S-LDSC41,63,64. We used two QTL annotations: (1) m6A-QTL continuous annotation using PIP from fine-mapping (with uniform prior); (2) m6A-QTL PIP annotation conditional on eQTL and sQTL PIP annotations (with uniform prior). Error bars represent the 95% confidence intervals. c, Summary of GWAS trait heritability enrichment for all 45 traits using m6A-QTL PIP (with uniform priors) as annotation conditional on the baseline LD model. The dashed line shows the significance threshold at FDR 5%. d, Proportion of GWAS trait heritability explained by m6A-QTLs, eQTLs and sQTLs. Because it would be hard to estimate heritability contribution using PIP (continues annotation) from fine-mapping, we used binary annotations at SNP-level FDR 10% threshold in this analysis. Error bars represent standard errors.
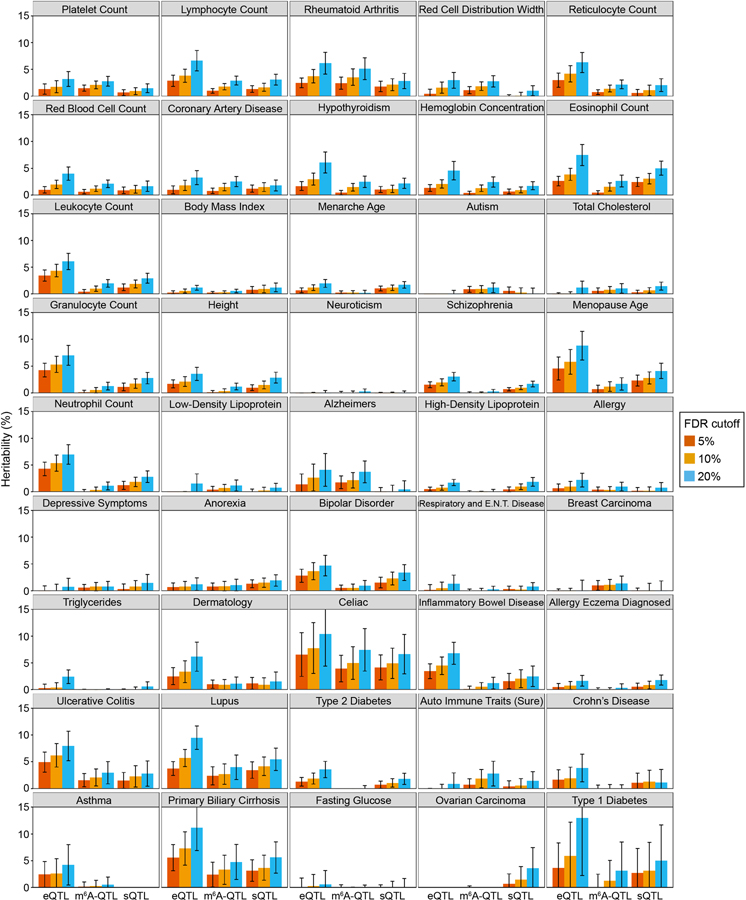
Using S-LDSC, we compared the relative contributions to trait heritability by m6A-QTLs, eQTLs and sQTLs (FDR < 10%). For traits in which m6A-QTNs show enrichment (Fig. 5c), m6A-QTLs explain about 2–5% of heritability, comparable to sQTLs and roughly 50–100% of the heritability explained by eQTLs (Fig. 5d, Extended Data Fig. 8). These estimates are likely conservative, as many QTLs below the FDR cutoff may contribute to trait heritability. Nevertheless, given the established roles of eQTLs and sQTLs, this relative comparison suggests that m6A-QTLs can make a significant contribution to heritability of complex traits.
TWAS using m6A-QTLs.
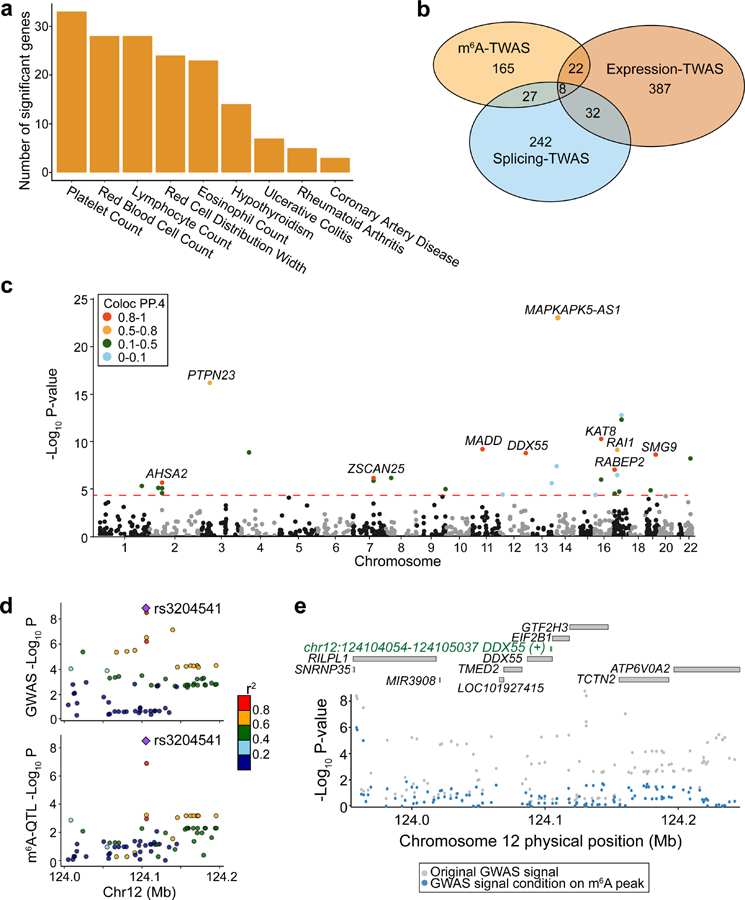
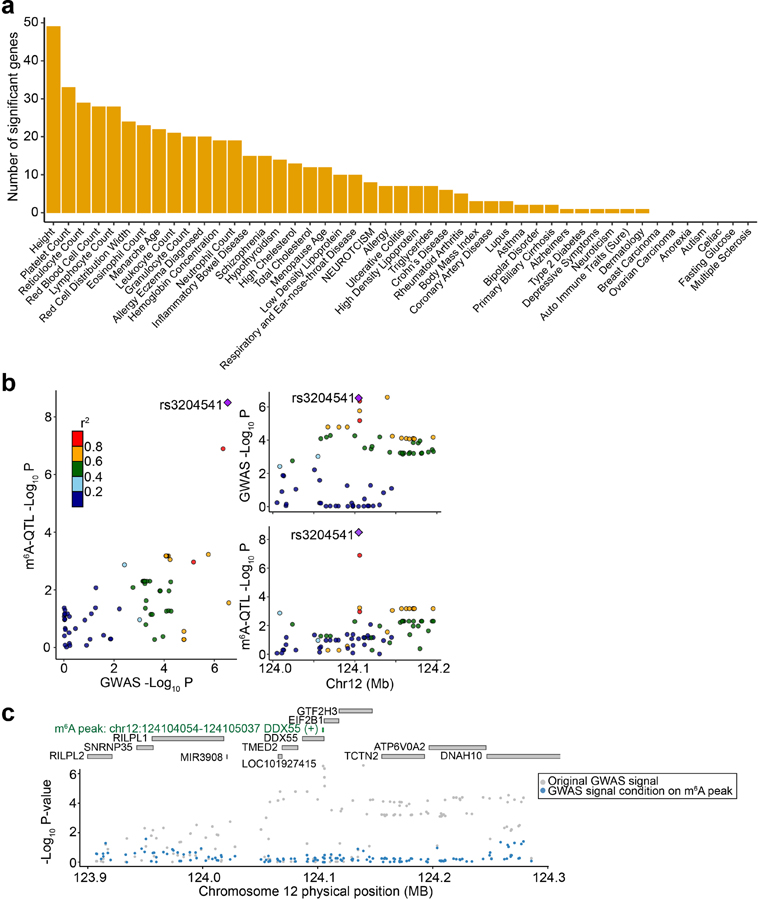
To highlight the potential of using m6A-QTLs to identify specific risk genes, we performed TWAS72,73 using m6A as a molecular-level trait. We built prediction models of m6A levels using genetic variants as explanatory variables, then assessed if genetically determined m6A levels correlate with specific phenotypes using TWAS/FUSION72. We find a number of m6A peaks passing Bonferroni threshold across a range of immune and blood-related traits (Fig. 6a) as well as several other phenotypes (Extended Data Fig. 9a). These results show limited overlap, at the level of genes, with TWAS results using eQTLs and sQTLs mapped in LCLs (Fig. 6b, Supplementary Table 3), suggesting that m6A variation represents a distinct path from genetic to phenotypic variation.
Fig. 6: m6A-TWAS and colocalization analysis.
a, Number of significant m6A-TWAS genes in selected immune and blood-related traits. b, Overlaps between significant genes discovered by TWAS analyses using m6A, expression and splicing as molecular-level phenotypes. c, Manhattan plot of m6A-TWAS associations of lymphocyte count. The dashed line shows the Bonferroni-corrected P value threshold of 0.05. Genes are colored by Coloc PP.4 (posterior probability of GWAS trait and m6A-QTL sharing common genetic causal variants). 10 genes with Coloc PP.4 > 0.5 are labeled. d, Aligned Manhattan plots of GWAS and m6A-QTL at DDX55 locus generated by LocusCompare. SNPs are colored by LD (r2) with the lead m6A-QTL (rs3204541). e, Manhattan plot of GWAS association signal of lymphocyte count at DDX55 locus before (gray dots) and after (blue dots) conditioning on the TWAS-predicted m6A level. The top panel labels all genes within 200 kb and the significant m6A peak (green).
We performed an in-depth analysis of lymphocyte count. m6A-TWAS identified a total of 30 significant m6A peaks in 28 genes (Fig. 6c). Since TWAS associations can result from LD and/or pleiotropic effects73, we conducted colocalization analysis74 to identify cases where a single causal variant drives both m6A-QTL and GWAS association. Among 30 peaks, 10 have high colocalization probabilities (PP4 from Coloc > 0.5) (Supplementary Table 4). As one example, an m6A peak in the DDX55 gene shows high colocalization probability (PP4 = 0.929). The SNP driving colocalization result, rs3204541, is the top SNP in both m6A-QTL and GWAS (Fig. 6d). A conditional association test adjusting for m6A shows that the TWAS association almost fully explains the GWAS signal in the region (Fig. 6e). The same m6A peak in DDX55 is also found by m6A-TWAS in leukocyte counts (Extended Data Fig. 9b, c). DDX55 is a DEAD-Box Helicase gene, and its paralog gene, DDX10 is implicated in myelodysplastic syndrome, a disease with abnormal blood cell counts75. Importantly, DDX55 is not found by expression or splicing-TWAS (both P values ≥ 0.1). Together, our TWAS results highlight the promise of using m6A-QTLs to reveal mechanisms in GWAS loci where genetic effects are not mediated by expression or splicing.
Discussion
We report a systematic genetic analysis of the most abundant mRNA modification—N6-methyladenosine. Our analysis reveals insights into m6A regulation, highlighting the importance of both RNA-features (e.g. RBPs, secondary structure) and transcriptional regulation (e.g. TF binding). We find that the functional effects of m6A on downstream processes, in particular translation, can be highly heterogeneous and depend on binding of specific RBPs. Our integrated analysis of m6A-QTLs with GWAS supports the role of m6A as an important link from genetic to phenotypic variation.
Using an analysis that correlates SNP effects on RBP motifs and m6A levels, we identified specific RBPs such as SRSF1, that may be m6A regulators (Fig. 2e). This analysis, however, has some limitations. It may not be able to distinguish RBPs from the same families that share similar motifs. Due to small sample size of our study, it may also be underpowered to detect many more RBPs regulating m6A. The enrichment of m6A-QTLs in transcription-related features supports an emerging connection between mRNA modification and transcriptional control56–58. As a support of the “recruitment model” (Fig. 3b), TF binding sites are enriched in m6A-QTLs and several TFs interact with m6A methyltransferase complex in LCLs. Given additional TF-methyltransferase interactions reported previously in pluripotent stem cells56,58 and AML23, we think TF-methyltransferase interactions may broadly exist and participate in cell-type-specific m6A regulation.
Previous studies found that m6A promotes translation efficiency and mRNA decay via interactions with reader proteins2. Our results add nuance to this model, suggesting that m6A effects on downstream processes, e.g. translation, are much more heterogeneous across transcripts than previously appreciated. We identified RBPs that may influence the effects of m6A, including some with reported functions in RNA processing (Fig. 4c, d), including YBX376, and HNRNPA177. The RBPs uncovered here provide a resource for future studies.
We hypothesize two potential mechanisms that may explain context-dependent m6A effects. First, there may be more m6A reader proteins, with potentially different effects, than are currently known; some could be readers that respond to m6A through structure-switch mechanism78. Alternatively, the functions of RNA regulators may depend on m6A, even if they do not directly bind and recognize m6A nor respond through structure switch (and hence not readers). These proteins may bind the motif that harbors m6A or a motif nearby m6A sites, and compete with bona fide reader proteins on the modified transcripts. Future studies are needed to assess these RBPs and their interactions as well as competition in RNA binding.
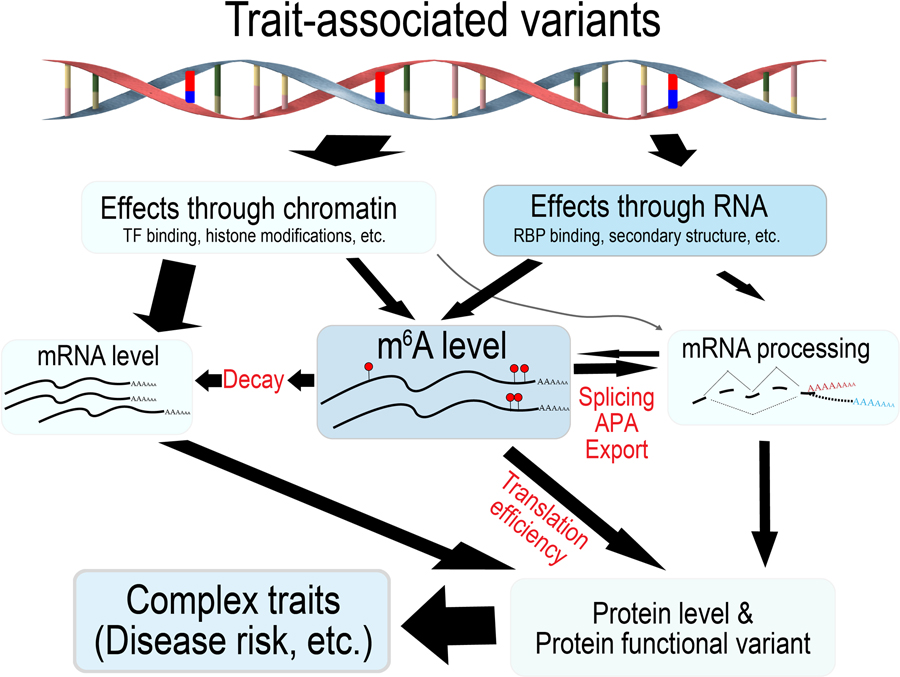
Our integrated analysis of m6A-QTLs and GWAS highlights the importance of m6A to the etiology of complex traits and adds to the growing evidence that post-transcriptional regulation (PTR) plays a key role in common diseases. Genetic variants affecting RNA-processing are almost as common as, and are largely independent from, those affecting transcription79. These variants have been implicated in a number of diseases including cystic fibrosis, type 2 diabetes, Crohn’s disease, and lung cancer79. Identifying variants with PTR effects, however, is more challenging than transcriptional effects. Mapping m6A-QTLs may be an effective strategy to address this challenge, given the central role of m6A modification in almost every step of RNA processing (Extended Data Fig. 10).
One potential caveat of our GWAS analysis is the mismatch between population ancestries of QTL (African) and GWAS (mostly European) data. The impact of this mismatch, however, is likely limited. Studies have suggested that associations with complex traits, especially causal variants, are broadly shared across populations80. A systematic study with multiple complex traits estimated that more than 80% of causal variants are shared between Europeans and Asians81. In another study, TWAS on asthma using eQTL models trained on data from Europeans and Africans gave broadly similar results82. Given these findings, we think many m6A-QTNs (causal variants) in Yoruba LCLs are likely shared in Europeans. Therefore, population mismatch likely has a small impact in our S-LDSC analysis, which used PIPs as SNP annotations; and in our TWAS, where results are often driven by single shared variant between molecular QTL and GWAS83. Finally, we note that population mismatch will generally reduce the signal, i.e. sharing of QTL and GWAS effects, leading to underestimation of enrichment in S-LDSC and false negatives in TWAS, but not false positive findings.
Moving forward, we think there are two main challenges and opportunities to leverage m6A-QTLs to study disease genetics. First, more work needs to be done to characterize the possible mechanisms of how m6A-QTLs influence phenotypes. Second, eQTLs or sQTLs are often cell-type- and condition-specific84,85. For m6A, recent studies suggest that its effects on decay or translation are likely strongest in cells undergoing differentiation18,86 or stimulation9,10. A major future direction is thus to map m6A-QTLs under various disease-related cellular and physiological contexts.
Materials and Methods
Cell culture.
Human lymphoblastoid cell lines (LCL) of 60 Yoruba individuals were purchased from Coriell Institute. These 60 individuals were chosen by the availability of other molecular QTL data in previous studies27,29,30,33,43. Upon receiving them, cells were split into flasks as technical replicates and were processed independently thereafter. Cells were cultured and propagated in RPMI 1640 medium with 15% FBS at 37ºC and 5% CO2 until harvest.
RNA extraction and m6A-seq.
Cells were harvested by 1,000x g centrifugation. Total RNA was extracted from cell pellets using TRIzol (Invitrogen) and Direct-Zol RNA extraction kit (Zymo Research cat. R2072) according to the manufacturer’s instructions. mRNA was further purified with Dynabeads mRNA DIRECT purification kit (Thermo Fisher, cat. 61011). mRNA was adjusted to 15 ng/µl in 100 µl and fragmented using Bioruptor ultrasonicator (Diagenode) with 30s on/off for 30 cycles.
Approximately 50 ng of fragmented mRNA was saved as input sample and ~1,450 ng was subject to m6A-immunoprecipitation (m6A-IP) with EpiMark N6-Methyladenosine enrichment kit (NEB cat. E1610S). To minimize the variation due to IP experiment, which is often a great source of technical noise in IP-based sequencing, m6A-IP was performed by a robot (KingFisher Duo Prime System) for 12 samples at a time. Though a monoclonal antibody was used, we further controlled for lot variation by pooling antibody prior to aliquot to each of the 60 samples.
RNA eluted from m6A-IP was cleaned using RNA Clean and Concentrator (Zymo Research, cat. R1013). Input and IP samples were then used to prepare library with KAPA mRNA Hyper Kit (Roche, Cat. KK8541). A total of 240 libraries (duplicates per individual, each with an input and IP) were constructed in three batches. All libraries were sequenced by the HiSeq4000 platform at SE50 mode at the sequencing core facility at the University of Chicago. For each batch of library constructed, all libraries (with distinct index) were pooled and sequenced at a lane together for 3–5 repetitive lanes. This study design balanced the lane effect on each batch of libraries. In sum, about 30 million reads were obtained for each library and reads from technical replicates were pooled to result in 60 million reads for each input and IP sample per individual.
m6A-sequencing data alignment.
For each dataset, the raw sequencing data were mapped to the hg19 reference genome by Hisat2 with parameter --known-splicesite-infile <splice-file extracted from Refseq hg.19 GTF file> -k 1. We used WASP87 to control for the alignment bias due to genetic variations. The BAM files obtained from alignment are used as an input file for reads quantification.
Joint m6A peak calling across samples.
Genes (concatenated exons) are divided into 50-bp consecutive bins where read counts of input and IP sample were quantified. Second, we applied a two-tailed Fisher’s exact test to call bins significantly enriched in IP vs. input. Specifically, we constructed a contingency table consisting of the read counts of a bin in the input (a) and in the IP (b), and the median read count of the bins in the gene containing the bin in the input (c) and in the IP (d). The odds ratio is represented as . The FDR control procedure was performed on each gene and an FDR < 5% cutoff was used to call a bin peak for each sample. Third, to obtain a common set of peaks for all QTL analysis, we define joint m6A-peaks by requiring a bin to be called as peak in at least 5 individuals. Neighboring bins that satisfied this criterion were merged into a single peak. Then, a pair of read counts (the input and IP) were obtained for each of the joint m6A peaks. Finally, we filtered out peaks with zero read in any of the samples.
To obtain consensus motif of m6A, we used Homer288 to search for de novo motifs in m6A peak sequences with the parameter -len 5,6,7 -rna -S 5 -noknown. As a background control, we extracted sequences from random peaks of 200-bp size that were sampled from mRNA transcript.
To visualize the distribution of m6A peaks on the transcript, we generated meta-gene plot using the R package Guitar89 with default settings.
m6A-QTL mapping.
m6A-seq experiments are characterized by a pair of input and immunoprecipitation (IP) measurements. For a given testing window (as defined by joint m6A-peaks), the read counts of IP (immunoprecipitated) and input (regular RNA-seq) in individual are denoted as and , respectively. Let and be the library size of IP and input, respectively. We define log odds ratio (log-OR) as the m6A quantitative phenotype:
| (1) |
We next corrected for GC content and sample differences as shown in the Supplementary Note. We then standardized the log2OR by subtracting out the mean and dividing by the standard deviation of each peak followed by quantile normalization. We applied a linear model implemented in FastQTL46 to test the association between phenotypes and genotypes, adjusting for 15 principal components (PCs). The number of PCs was chosen to maximize power. We tested cis-associations between peaks and SNPs within 100 kb, as explained in the text.
To account for multiple genetic variants tested for each peak, we performed 1,000 rounds of permutation and used the beta-approximation scheme in the FastQTL to obtain empirical P values for each peak. We then used Storey’s q value method47 to obtain false discovery rate (FDR), accounting for multiple peaks tested.
Genotype data and imputation.
We downloaded the latest 1000 genomes project combined variant calling data release90 where 50 samples of ours are covered in this dataset. For the rest 10 samples, there are 8 sample covered in the chip array genotyped data from 1000 genomes. For the two individuals that are not covered in the 1000 genomes genotype data, we obtained their genotype data from HapMap and lifted over the hg18 coordinates to match the others’ hg19 coordinates. To fill the missing genotypes of these 10 individuals that are not covered in the 1000 genomes combined variant call dataset, we pre-phased and imputed missing genotypes using Impute291,92. Overall, we obtained genotypes for 9,821,958 SNPs that has MAF > 5%.
Spatial distribution and genomic annotation of the m6A-QTLs.
To characterize the spatial distribution of the m6A-associated SNPs with respect to the m6A peaks, we calculated the distance from the SNP to the center of the corresponding peak. Since m6A is an RNA modification, the distances were calculated with respect to the transcript strand where a negative distance indicates an upstream location of the transcript and vice versa. m6A-QTL SNPs were assigned to 5’ UTR, CDS, 3’ UTR, intron and intergenic annotation using the R package ChIPseeker93. For SNPs that could be assigned to different annotation due to multiple isoforms of a gene, the annotation priority was set to be UTR > CDS > Intron > Intergenic.
Comparisons between m6A-QTLs vs. eQTLs or sQTLs.
To compare m6A-QTLs with eQTLs (both at FDR < 10%), we compared the overlap of ePeak-harboring genes and eGenes in the same cohort of YRI LCL samples36. Then, for those genes with both ePeak and eGene mapped, we computed the pairwise distances and LD between the lead ePeak SNPs and the eGene SNPs. To compare m6A-QTLs with sQTLs (both at FDR < 10%), we used the sQTL data from a larger cohort of GEUVADIS YRI LCL samples (n = 87)43. We mapped intron clusters with at least one significant sQTL (denoted as eSplicing intron clusters) and compared the overlap of ePeak-harboring genes and genes containing eSplicing intron clusters. For genes with multiple m6A ePeaks and/or multiple eSplicing intron clusters, we computed the pairwise distances and LD between all pairs of the lead ePeak SNPs and the eSplicing SNPs.
Functional annotations of m6A-QTLs.
Our functional annotations include m6A consensus motif (RRACH) in m6A peaks, RNA binding protein (RBP) CLIP-seq peaks in K562 and HepG2 cells from ENCODE50, transcriptional factor (TF) and histone modifications ChIP-seq peaks in LCLs from ENCODE59, experimentally determined RiboSNitch51 and predicted microRNA binding site by TargetScan52.
To annotate SNPs by the m6A consensus motif (RRACH) in m6A peaks, we used MotifBreakR94 to find instance of m6A motifs overlapping with SNPs. We then intersected these motif matches with the joint peaks to obtain motifs in m6A peaks. For RBP CLIP-seq peaks, we intersected the peaks of the two replicates and from the two cell lines to obtain a peak set that are consistent across replicates and cell lines. These peaks shared across cell lines are more likely to be functional in LCL than those in single cell line. To define ChIP-seq peaks for TFs and histone markers, we chose peaks that are “optimal IDR peaks” as defined by the ENCODE processing pipeline. We used the microRNA binding sites predicted by TargetScan52, limit to the sites that are targeted by microRNA expressed in the LCLs. MicroRNA expression data were obtained from the microRNA-seq data of LCLs samples from GEUVADIS95. We defined a microRNA being expressed in LCLs by requiring the median read count across individuals to be at least five.
Enrichment of functional annotation in m6A-QTLs.
We took the independent SNPs from the fine-mapped m6A-QTLs (see Fine-mapping m6A-QTL Section) by choosing SNPs with the maximum posterior inclusion probability (PIP) per credible set. We then compared the number of QTLs vs. the number of random control SNPs overlapping with a functional annotation using the two-tailed Fisher’s exact test. To generate the control SNP set, we used a modified version of SNPsnap53 to sample 100 sets of SNPs that match the allele frequencies, numbers of SNPs in LD, distances to the nearest genes, gene density as well as annotations about SNP locations relative to genes (5’ UTR, CDS, 3’ UTR, intron and intergenic regions).
We also used Torus39 as an alternative method to assess the enrichment of functional annotation in the m6A-QTLs. Torus fits a logistic regression model to estimate an enrichment parameter for each annotation, which enables joint analysis of multiple annotations.
Learning motifs of RBPs from CLIP-seq data.
For each RBP, we took the top 3,000 peaks as ranked by peak strength of each replicate and retain the ones that are consistent in both replicates. We then extend 5 bp at both sides for peaks that are shorter than 10 bp. The sequence of the resulted peaks served as target sequence for de novo motif search by Homer2. To generate matched background peaks for each RBP, we first generated a large set of random peaks of length 70 bp (the mean width of CLIP-seq peaks) on the transcribed region including both exons and introns. Then we annotated the genomic locations (5’ UTR, CDS, Intron, 3’ UTR, etc.) of the top CLIP-seq peaks and drew random peaks with matched distribution of genomic annotation. At least one motifs of P value < 1 × 10⁻¹⁰ were obtained for 113 RBPs. For each RBP, the top 2 motifs sorted by P value were used for motif correlation analysis of RBP binding (Fig. 2e).
To visualize the motifs, we used the R package Loglas96 to generate sequence logo plots that highlight both nucleotide conservation and depletion.
Fine-mapping m6A-QTLs, eQTLs and sQTLs.
Many significant m6A-QTLs are likely not causal variants but tagging the causal SNPs. To better identify independent associations and likely causal variants, we performed fine-mapping of m6A-QTLs using the state-of-art tool SuSiE48. We used the standard version of SuSiE that takes individual-level phenotype and genotype data. For SuSiE parameters, the maximal causal variants per region was set to 3 and estimate_prior_variance = TRUE.
We first fine-mapped m6A-QTLs with uniform prior inclusion probability and applied this version in most of our analyses including enrichment analysis comparing m6A-QTLs with control SNPs by Fisher’s exact test, m6A-QTL RBP-motif break analysis and partition of GWAS traits heritability analysis. We also performed another version of fine-mapping that leveraged RNA annotations including RiboSNitch, RBP binding sites by using informative priors in SuSiE fine-mapping. For example, a SNP close to a peak and located in an RBP binding site would have a higher prior probability of being a causal variant. The informative prior probability used in fine-mapping was derived from the functional annotation enrichment analysis using the program Torus with flag: -dump_prior. We used the RNA-features-informed fine-mapping results in the S-LDSC analysis of enrichment of GWAS variants in m6A-QTNs (Extended Data Fig. 7).
Similarly, we fine-mapped eQTLs and sQTLs using SuSiE on individual-level expression and splicing data in GEUVADIS YRI LCL samples with uniform prior and the same parameter settings as fine-mapping m6A-QTLs.
Evaluating the role of RBP binding in regulating m6A levels.
We checked whether the impact of genetic variants on RBP binding is correlated with the effect on m6A levels, measured by m6A-QTL effect size, in a directionally consistent manner. To assess the effect of genetic variants on RBP binding affinity, we used MotifBreakR94 to map SNPs that breaks a RBP motif. A cutoff of P value < 1 × 10⁻³ was used to filter the motif match result in the parameter setting. To enhance signals, we used fine-mapped m6A-QTLs as described in Fine-mapping m6A-QTL Section. To include more SNPs in this analysis, we used all SNPs with PIP > 0.5 and for ePeaks without SNP PIP > 0.5, we included the maximum PIP SNPs to select likely causal SNPs in this analysis. For each RBP, we chose the motif-breaking SNPs and peak pairs that are within 0.5 kb range with the assumption that m6A is mainly affected by RBPs bound close to the m6A sites. RBPs with less than 10 SNP-peak pairs were not included in the analysis. In total, we assessed the correlation between binding affinity change of 37 RBP motifs and m6A-QTL effect sizes. Storey’s q value method was used for FDR control.
Estimating contribution of RNA features and TFs to the m6A-QTLs.
To compare the relative contribution of RBP binding, secondary structure, RRACH motif, microRNA binding and TF binding to the installation of m6A, we estimated the proportion of putative causal m6A-QTNs falling in each of these annotation categories. Specifically, we took all SNPs from the credible sets of SuSiE fine-mapping and summed the PIP of SNPs in each annotation category to obtain an estimation about the expected “number” of causal SNPs related to each mechanism. To compute the proportion, we divided the summed PIP of each annotation category by the sum of PIP across all SNPs in credible sets.
Joint analysis of transcription-rate-QTLs and m6A-QTLs.
We downloaded published transcription-rate-QTL data43 where transcript rate was measured by 4SU-seq at two labeling time points (30 min and 60 min) in the same cohort of YRI samples as in our study. 4SU-seq labels newly synthesized RNA using nucleotide analog 4-thiouridine (4SU), allowing for pulldown of the labeled newly synthesized RNA for sequencing. We note that 4SU-seq quantifies the overall transcription rate, but does not distinguish different events (e.g. PolII pausing vs. slow progression) leading to transcription rate change.
Validating TFs interaction with m6A methyltransferase by co-immunoprecipitation experiments.
To experimentally validate that some TFs interact with m6A installing machinery, we performed co-immunoprecipitation (co-IP) experiments for several TFs following a modified protocol from an earlier study56. Briefly, 150 µl LCL cell pellet was washed with 10 volumes of PBS once, then washed with 10 volumes of hypotonic lysis buffer (10 mM Tris-HCl pH 7.5, 10 mM KCl, 2 mM MgCl2, 0.2 mM EDTA, 0.2 mM DTT, 10 mM sodium butyrate, 1× protease and phosphatase inhibitor cocktail) once. The pellet was resuspended in 8 volumes of hypotonic lysis buffer for 5 minutes to swell cells. We then homogenized the swollen cells using the “loose” pestle of a 2-ml Dounce homogenizer for 200–300 strokes. Nuclei were pelleted at 800 g for 5 minutes followed by washing once with hypotonic lysis buffer. The nuclei pellet was then resuspended in 4 volumes of nuclear lysis buffer (20 mM Tris-HCl pH 7.5, 50 mM KCl, 100 mM NaCl, 2 mM MgCl2, 10% glycerol, 0.1% Tween20, 0.2 mM EDTA, 0.2 mM DTT, 10 mM sodium butyrate, 1× protease and phosphatase inhibitor cocktail). The nuclei were homogenized by 150 strokes of the “tight” pestle of a 2-ml Dounce homogenizer. After nuclear lysis, Turbo DNase was added at a 1:20 ratio and the mix was incubated at 16ºC with rotation for 1 h. The resulting lysate was then cleared by centrifuge at 16,000 g, 4ºC for 20 minutes. Immunoprecipitations were performed by incubating cleared lysate with antibody specific to TFs (see Supplementary Table 5 for details of antibodies used) and 20 µl of corresponding protein A/G beads for 4 hours at 4ºC. We then applied 5 rounds of stringent washes using dialysis buffer (20 mM Tris-HCl pH 7.5, 50 mM KCl, 100 mM NaCl, 2 mM MgCl2, 10% glycerol, 0.2 mM EDTA, 0.2 mM DTT, 10 mM sodium butyrate, 1× protease and phosphatase inhibitor cocktail) followed by elution in 1× Laemmli SDS sample buffer.
Molecular QTLs from earlier studies.
We collected QTL data of multiple molecular traits in YRI LCLs from earlier studies, including transcription rate, mRNA levels, mRNA decay, mRNA splicing, ribosome loading and protein levels. We used processed phenotype data and YRI genotypes complied in Li et al.43 (downloaded from http://eqtl.uchicago.edu/jointLCL/). To map cis-QTLs for these molecular phenotypes, we chose SNPs within 100-kb windows around genes using linear regression by FastQTL, and regressed out PCs to maximize the number of detected QTLs in each molecular phenotype.
Alternative polyadenylation (APA) QTL.
Using the RNA-seq data (input) we generated, we predicted and quantified APA events based on sequencing coverage at the 3’ UTR regions using a modified version of DaPars97 as described in Li et al.43. We find 7,617 putative APA sites. Using the ratio of distal to proximal polyA site usage as a quantitative phenotype, we tested its association with genotypes within 100 kb range by FastQTL46. 7 PCs were included to maximize the QTL discovery. At SNP-level FDR < 10% (Storey’s qvalue method), we obtained 3,586 APA-QTLs.
Estimation of QTL sharing between m6A and other molecular phenotypes.
Following the procedure of Li et al.43, we first ascertained m6A-QTLs at a given P value threshold. We then limited our analysis to the lead SNP per m6A locus; thus, the SNPs we include are largely independent. We next assessed the proportion of non-null (π1) from P values of the ascertained SNPs in another molecular phenotype, using Storey’s method in the qvalue R package47. 80% bootstrap confidence intervals for the π1 estimates were computed by resampling P values with replacement 100 times. Control SNPs were randomly sampled across the genome.
QTL effect size correlation analysis stratified by RBP binding.
We ascertained lead m6A-QTLs, and grouped m6A peaks bound by different RBPs, requiring the genomic intervals of RBP binding sites to be entirely within m6A peaks (results are similar if we require only 1-bp overlap). 82 RBPs with at least 50 data points (peak-SNP pairs) were selected. In each group of m6A peaks bound by an RBP, we assessed the correlations of effect sizes between m6A-QTLs and QTLs of other molecular phenotypes. When computing effect sizes for molecular QTLs, we used the slope of the linear regression as a measure of effect size, and did not regress out PCs as that could modify effect size estimates43. Significant correlations of effect sizes between m6A-QTLs and QTLs of other molecular phenotypes were selected at FDR (Benjamini & Hochberg method) 10% threshold.
Re-analysis of ribosome-profiling data of METTL3 and YTHDF1 knockdown in Hela cells.
To validate our finding of heterogeneous effect of m6A on downstream molecular traits, we used translation efficiency as an example and re-analyzed the ribosome profiling data of METTL3- (m6A methyltransferase) and YTHDF1- (m6A reader) depleted Hela cells from a published study8. The detailed description was in the Supplementary Note.
Validating YBX3 function in repressing translation efficiency.
We depleted YBX3 using siRNA (Qiagen, Cat No. SI00355019) in Hela cells and performed polysome profiling as described previously8 to assess the effect on translation efficiency. We quantified transcripts level of selected targets in three polysome-bound fractions: monosome, polysome1 and polysome2 (as indicated in Extended Data Fig. 5a) and non-polysome-bound fraction for further gene-specific analysis. We selected 5 YBX3 target genes from the analysis of ribosome profiling data in m6A depleted cells; all 5 YBX3-targets have m6A peaks overlapping with YBX3 CLIP-seq peaks and showed increased TE upon m6A depletion. As negative controls, we selected 3 YTHDF1-targets, which showed decreased TE upon m6A depletion. For each gene, we normalized the monosome, polysome1 and polysome2 fractions by the non-polysome-bound fraction to obtain a translation efficiency estimation.
GWAS summary statistics.
We download summary statistics of 45 phenotypes from UK Biobank98, the Price laboratory41 and the GWAS Catalog. The GWAS traits and corresponding references are listed in Supplementary Table 6.
Testing enrichment of GWAS signals in m6A-QTL.
We extracted GWAS SNPs that also belong to m6A-QTLs (association P value < 1 × 10⁻⁴) and plotted the QQ-plot of the GWAS P values for those SNPs. Similarly, we plotted GWAS SNPs that are also eQTLs or sQTLs (association P value < 1 × 10⁻⁴) for comparison. Genome-wide GWAS P values were also plotted as a control.
Heritability and enrichment analysis of GWAS summary statistics using S-LDSC.
We partitioned the heritability of complex traits and estimated heritability enrichment of m6A-QTL, eQTL and sQTL41,63,64. S-LDSC partitions the heritability of genomic annotations using GWAS summary statistics and estimates the enrichment as a ratio of the proportion of heritability explained by an annotation divided by the proportion of SNPs in that annotation.
We then constructed a probabilistic (continuous-valued) annotation using PIP (posterior inclusion probability) estimates from SuSiE fine-mapping with RNA-features-informed prior (Extended Data Fig. 7) or uniform prior inclusion probability (Fig. 5b–d). We applied S-LDSC to our QTL-based annotations using separate models for each QTL annotation and joint model with all three types of QTL annotations together. In our S-LDSC analysis, we adjusted for various baseline annotations of SNPs using a baselineLD model63, including gene annotations (coding, UTRs, intron, promoter), MAF bins and LD-related annotations. We did not include functional annotations such as enhancer markers in our baseline model, because these annotations are likely correlated with the QTL features of interest (e.g. enhancers are enriched in eQTLs), and including them will bias our estimated enrichment.
To estimate heritability explained by molecular QTLs, we constructed a binary annotation containing all SNPs at given SNP-level FDR cutoffs. We repeated the analysis on m6A-QTL, eQTL, sQTL at thresholds of 20%, 10% and 5% FDR (Extended Data Fig. 8). We find our conclusion is robust at varying thresholds.
TWAS and heritability analysis of m6A peaks.
TWAS was performed using the FUSION72 software. We trained regression models (LASSO, Elastic Net and top SNPs) using our own m6A data in LCLs, published RNA-seq data in YRI LCLs95, and splicing data99 using GEUVADIS YRI LCLs data43, and the corresponding YRI genotype data. In m6A-TWAS analysis, we computed weights for each m6A peak using LASSO and Elastic Net models as well as regression model with the single most significantly associated SNPs (using the R function FUSION.compute_weights.R provided by FUSION with parameter --models lasso,enet,top1). The best performing model in cross-validation was selected for each peak to perform imputation. We used a 100-kb cis-window, and restricted the genotypes to the set of markers in the LD reference panel (1000 Genomes European samples) provided on the FUSION website (http://gusevlab.org/projects/fusion/), as we used the LD reference data for the GWAS-m6A association analysis. 19,130 m6A peaks had estimated heritability (Extended Data Fig. 2a). We obtained trained weights for 918 peaks with estimated heritability significantly greater than 0 (with default parameter hsq p = 0.01). We then performed imputation of genetically determined m6A levels and estimated GWAS-m6A associations. We selected genome-wide significant m6A peaks/genes at Bonferroni-corrected P value < 0.05. Similarly, we built prediction model of gene expression as well as splicing (introns with missing values were ignored) and estimated the GWAS-gene expression as well as GWAS-splicing associations using FUSION.
Colocalization of m6A-QTL and GWAS associations.
Our colocalization analysis was performed using the Approximate Bayes Factor (ABF) test implemented in software Coloc74, which has been incorporated in the TWAS/FUSION pipeline. Coloc computes five posterior probabilities (PP0, PP1, PP2, PP3 and PP4), each corresponding to a hypothesis – H0: no association with either trait; H1: association with trait 1, not with trait 2; H2: association with trait 2, not with trait 1; H3: association with trait 1 and trait 2, two independent SNPs; H4: association with trait 1 and trait 2, one shared SNP. We ran coloc incorporated in the FUSION pipeline with default parameters for TWAS-significant associations (using the R function Fusion.assoc_test.R in FUSION software with --coloc_P flag) and used PP4 to assess evidence of colocalization. We visualized the colocalization of m6A-QTL and GWAS associations using LocusCompareR package (https://github.com/boxiangliu/locuscomparer).
Reporting Summary
Further information on research design is available in the Life Sciences Reporting Summary linked to this article.
Data availability
The m6A profiles of the 60 YRI samples generated in this study have been deposited in GEO repository: accession GSE125377. Raw data associated with Figure 3e is in the Supplementary Information.
Code and software availability
The code used for m6A-QTL data processing and analyses are available at: https://scottzijiezhang.github.io/m6AQTL_reproducibleDocument/index.html.
Our method for joint peak calling is implemented as an R package “MeRIPtools” and is freely available at: https://github.com/scottzijiezhang/MeRIPtools.
Extended Data
Extended Data Fig. 1. Joint m6A peak calling and QTL mapping.
a, Distribution of merged m6A peak length. Dash line marks the mean peak width. b, Distribution of all m6A peaks vs. ePeaks on a meta-gene. c, Proportion of all m6A peaks vs. ePeaks in each genomic annotation. d, m6A motif learned by Homer2, and visualized using EDlogo package. e, Spatial distribution of m6A-QTLs illustrated by density plot of SNP to peak distances of m6A-QTL with nominal P-value < 1X10⁻⁴ in a 2 Mb window surrounding m6A peaks. We also showed the significance by the -log10 P-value of the association tests in the blue dots. f, Volcano plot of overall statistics of m6A-QTLs with peak-level FDR < 10% (ePeaks). g, Distribution of the number of causal effects of ePeaks (FDR < 10%) by SuSiE fine-mapping with uniform prior. We set SuSiE parameters L = 3 (assuming at most three causal effects) and coverage = 0.95 (95% coverage for credible sets).
Extended Data Fig. 2. Heritability of m6A peaks and independence of m6A-QTLs, eQTL and sQTLs.
a, Distribution of estimated heritability of the 19,130 peaks included in the TWAS analysis, in which 918 peaks had estimated heritability significantly greater than 0 (minimum heritability P-value of 0.01). b, Distribution of estimated heritability of ePeaks (n = 822 peaks). c, Enrichment (log2 odds ratio) of m6A-QTLs in gene annotations. d, Distribution of the LD between the lead ePeak SNP and the eGene SNP in genes that have both ePeak and eGene mapped. e, Overlap between ePeak-harboring genes and eSplicing-harboring (splicing event with at least one significant sQTL) gene (both at FDR < 10%) mapped in YRI LCL samples. f, Distribution of the distance between the lead ePeak SNP and the eSplicing SNP in genes that have both ePeak and eSplicing mapped. g, Distribution of the LD between the lead ePeak SNP and eSplicing SNP in genes that have both ePeak and eSpicing mapped.
Extended Data Fig. 3. Contribution of RNA features and transcriptional features to m6A variation.
a, Enrichment of m6A-QTLs in RNA related features by Torus. Error bars represent the 95% confidence intervals. b, Enrichment of m6A-QTLs in the binding sites of RNA polymerase2 subunit A (POLR2A), and phosphorylated POLR2A at two residues (S2 and S5) by Torus joint analysis of all annotations (upper panel), and enrichment of m6A-QTLs in histone modifications from Torus joint analysis. Error bars indicate the 95% confidence intervals. c, Proportion of putative causal m6A-QTNs in RNA features and transcription factor binding site annotations (see Methods). d-e, To confirm that transcription rate affects mRNA and protein level, we ascertained transcription rate QTLs (Txn-QTLs) and assessed the correlation between transcription rate (Txn)-QTL effect sizes (30 min and 60 min 4sU labelling, respectively) and eQTL effect size (panel d, n = 425 and 1,387 SNP-gene pairs), and protein-QTL effect sizes (panel e, n = 425 and 408 SNP-gene pairs). Correlation is computed using linear regression. Fitted lines and 95% confidence intervals are shown in blue lines and shades.
Extended Data Fig. 4. Downstream effects of m6A are context dependent.
a, The number and fraction of m6A-QTLs in chromatin related genomic regions (using the union of promoter and enhancer regions annotated by ChromHMM in GM12878 cell line), and in chromatin related eQTLs (eQTLs with nominal P-value < 0.05 and also in promoter and enhancer regions). b, High correlations of effect sizes between molecular QTLs along the cascade from transcription to translation. Correlation is computed using linear regression, in which fitted lines and 95% confidence intervals are shown in blue lines and shades. c, Log2 fold change of translation efficiency of m6A methylated transcripts in METTL3 knockdown vs. controls. d, Log2 fold changes of translation efficiency upon YTHDF1 (m6A reader protein) knockdown. Transcripts harboring YTHDF1-bound m6A peaks are labeled in yellow and non-targets in blue.
Extended Data Fig. 5. YBX3 mediates translation efficiency of m6A modified transcripts.
a, Sucrose gradient A260 absorbance profile from YBX3 knockdown and control Hela cells. The arrows indicate the fraction sampled for subsequent qPCR analysis of YBX3 target transcripts. This experiment is repeated 2 times. b, Translation efficiency of YBX3 targets in comparison with YTHDF1 targets. We accounted for mRNA level variation by dividing polysome-bound fraction by the non-polysome-bound fraction. Transcript levels are quantified using RT-qPCR. Three polysome-bound fractions, as indicated in panel a, are sampled from sucrose gradient fractionation. 2 technical replicates were measured to obtain the data. The lower and upper hinges correspond to the first and third quartiles. Horizontal line indicates median value, and whiskers correspond to the value no further than 1.5x inter-quartile range.
Extended Data Fig. 6. Enrichment of GWAS signal in m6A-QTLs.
a, Quantile-quantile (QQ) plots of P-values from GWAS of selected traits. m6A-QTLs, eQTLs and sQTLs are shown in comparison with genome wide SNPs. GWAS SNPs are binary annotated using m6A-QTLs, eQTLs and sQTLs with P-value < 1X10⁻⁴. b, Enrichment of GWAS trait heritability assessed by stratified LD-score regression (S-LDSC). Shown are the results of GWAS traits not reported in Fig. 5b. Posterior inclusion probability (PIPs) in this analysis are derived from SuSiE with default (uniform) priors. Error bars represent the 95% confidence intervals.
Extended Data Fig. 7. Enrichment of complex trait heritability in m6A-QTNs using RNA-features-informed priors.
a, Enrichment of selected immune and blood GWAS trait heritability assessed by stratified LD-score regression (S-LDSC). PIPs of m6A-QTLs are derived from SuSiE using RNA-features-informed priors. PIPs of eQTL and sQTL are based on uniform prior. Error bars represent 95% confidence intervals. b, Enrichment parameters of annotations that are used to derive RNA-features-informed priors (by Torus) for SuSiE fine-mapping. Error bars represent the 95% confidence intervals. c, Summary of GWAS traits heritability enrichment analysis using m6A-QTL PIP (using RNA-feature informed priors) as annotation. The -log10 P-value is plotted against the enrichment of heritability. The dots are colored by disease category. The red dashed line shows FDR 5% threshold.
Extended Data Fig. 8. Partitioning complex trait heritability by m6A-QTLs, eQTLs and sQTLs.
Heritability is assessed by S-LDSC in which QTLs are binary annotated with varying SNP-level FDR thresholds of 5%, 10%, and 20%. Error bars represent standard errors.
Extended Data Fig. 9. m6A-TWAS identifies putative risk genes in human complex traits.
a, Number of significant m6A-TWAS genes in all 45 GWAS traits. Significance is defined by the Bonferroni corrected P-value 0.05. b, LocusCompare plot showing the scatter plot and aligned Manhattan plots of leukocyte count GWAS and m6A-QTL association signal at the DDX55 locus. c, Manhattan plot of GWAS association signals before and after conditioning on the TWAS-predicted m6A level (gray and blue dots, respectively) for the leukocyte count at the DDX55 locus.
Extended Data Fig. 10. m6A modification mediates the impact of genetic variation on human complex traits.
Genetic variation exerts its impact on complex traits through varies mechanisms. As one of these mechanisms, we propose that variation of m6A modification may lead to variation of mRNA processing, including mRNA decay, splicing, APA, export and translation efficiency. These variations in turn may change protein levels and functions, and lead to phenotypic variations.
Supplementary Material
Source Data Fig. 3 Raw Western Blots images.
Acknowledgements
We thank Y. Gilad, Y.I. Li, M. Chen and L. Barreiro for helpful discussions, and X. Wen for advice on computational analysis. Data on coronary artery disease have been contributed by CARDIoGRAMplusC4D investigators and have been downloaded from www.CARDIOGRAMPLUSC4D.ORG. C.H. acknowledges support from NIH RM1HG008935 (C.H.). X.H. acknowledges support from NIH R01MH110531 (X.H.). M.S. acknowledges support from NIH HG002585 (M.S.).
Footnotes
Competing interests
C.H. is a scientific founder and scientific advisory board member of Accent Therapeutics, Inc. and a shareholder of Epican Genetech.
References
- 1.Fu Y, Dominissini D, Rechavi G & He C Gene expression regulation mediated through reversible m(6)A RNA methylation. Nat Rev Genet 15, 293–306 (2014). [DOI] [PubMed] [Google Scholar]
- 2.Roundtree IA, Evans ME, Pan T & He C Dynamic RNA Modifications in Gene Expression Regulation. Cell 169, 1187–1200 (2017). [DOI] [PMC free article] [PubMed] [Google Scholar]
- 3.Xiao W et al. Nuclear m6A Reader YTHDC1 Regulates mRNA Splicing. Molecular Cell 61, 507–519 (2016). [DOI] [PubMed] [Google Scholar]
- 4.Kasowitz SD et al. Nuclear m6A reader YTHDC1 regulates alternative polyadenylation and splicing during mouse oocyte development. PLOS Genetics 14, e1007412 (2018). [DOI] [PMC free article] [PubMed] [Google Scholar]
- 5.Louloupi A, Ntini E, Conrad T & Ørom UAV Transient N-6-Methyladenosine Transcriptome Sequencing Reveals a Regulatory Role of m6A in Splicing Efficiency. Cell Reports 23, 3429–3437 (2018). [DOI] [PubMed] [Google Scholar]
- 6.Roundtree IA et al. YTHDC1 mediates nuclear export of N6-methyladenosine methylated mRNAs. eLife 6, e31311 (2017). [DOI] [PMC free article] [PubMed] [Google Scholar]
- 7.Wang X et al. N6-methyladenosine-dependent regulation of messenger RNA stability. Nature 505, 117 (2013). [DOI] [PMC free article] [PubMed] [Google Scholar]
- 8.Wang X et al. N(6)-methyladenosine Modulates Messenger RNA Translation Efficiency. Cell 161, 1388–1399 (2015). [DOI] [PMC free article] [PubMed] [Google Scholar]
- 9.Zhou J et al. Dynamic m6A mRNA methylation directs translational control of heat shock response. Nature 526, 591 (2015). [DOI] [PMC free article] [PubMed] [Google Scholar]
- 10.Shi H et al. m6A facilitates hippocampus-dependent learning and memory through YTHDF1. Nature 563, 249–253 (2018). [DOI] [PMC free article] [PubMed] [Google Scholar]
- 11.Li A et al. Cytoplasmic m6A reader YTHDF3 promotes mRNA translation. Cell Research 27, 444 (2017). [DOI] [PMC free article] [PubMed] [Google Scholar]
- 12.Shi H et al. YTHDF3 facilitates translation and decay of N6-methyladenosine-modified RNA. Cell Research 27, 315 (2017). [DOI] [PMC free article] [PubMed] [Google Scholar]
- 13.Liu J et al. A METTL3–METTL14 complex mediates mammalian nuclear RNA N6-adenosine methylation. Nature Chemical Biology 10, 93 (2013). [DOI] [PMC free article] [PubMed] [Google Scholar]
- 14.Wang P, Doxtader, Katelyn A & Nam Y Structural Basis for Cooperative Function of Mettl3 and Mettl14 Methyltransferases. Molecular Cell 63, 306–317 (2016). [DOI] [PMC free article] [PubMed] [Google Scholar]
- 15.Zheng G et al. ALKBH5 is a mammalian RNA demethylase that impacts RNA metabolism and mouse fertility. Molecular Cell 49, 18–29 (2013). [DOI] [PMC free article] [PubMed] [Google Scholar]
- 16.Jia G et al. N6-methyladenosine in nuclear RNA is a major substrate of the obesity-associated FTO. Nature chemical biology 7, 885–887 (2011). [DOI] [PMC free article] [PubMed] [Google Scholar]
- 17.Wei J et al. Differential m6A, m6Am, and m1A Demethylation Mediated by FTO in the Cell Nucleus and Cytoplasm. Molecular Cell 71, 973–985.e5 (2018). [DOI] [PMC free article] [PubMed] [Google Scholar]
- 18.Frye M, Harada BT, Behm M & He C RNA modifications modulate gene expression during development. Science 361, 1346 (2018). [DOI] [PMC free article] [PubMed] [Google Scholar]
- 19.Huang H et al. Recognition of RNA N(6)-methyladenosine by IGF2BP proteins enhances mRNA stability and translation. Nat Cell Biol 20, 285–295 (2018). [DOI] [PMC free article] [PubMed] [Google Scholar]
- 20.Edupuganti RR et al. N6-methyladenosine (m6A) recruits and repels proteins to >regulate mRNA homeostasis. Nature Structural &Amp; Molecular Biology 24, 870 (2017). [DOI] [PMC free article] [PubMed] [Google Scholar]
- 21.Liu J et al. m6A mRNA methylation regulates AKT activity to promote the proliferation and tumorigenicity of endometrial cancer. Nature Cell Biology 20, 1074–1083 (2018). [DOI] [PMC free article] [PubMed] [Google Scholar]
- 22.Deng X et al. RNA N6-methyladenosine modification in cancers: current status and perspectives. Cell Research 28, 507–517 (2018). [DOI] [PMC free article] [PubMed] [Google Scholar]
- 23.Barbieri I et al. Promoter-bound METTL3 maintains myeloid leukaemia by m6A-dependent translation control. Nature 552, 126 (2017). [DOI] [PMC free article] [PubMed] [Google Scholar]
- 24.Vu LP et al. The N6-methyladenosine (m6A)-forming enzyme METTL3 controls myeloid differentiation of normal hematopoietic and leukemia cells. Nature Medicine 23, 1369 (2017). [DOI] [PMC free article] [PubMed] [Google Scholar]
- 25.Li Z et al. FTO Plays an Oncogenic Role in Acute Myeloid Leukemia as a N6-Methyladenosine RNA Demethylase. Cancer Cell 31, 127–141 (2017). [DOI] [PMC free article] [PubMed] [Google Scholar]
- 26.Su R et al. R-2HG Exhibits Anti-tumor Activity by Targeting FTO/m6A/MYC/CEBPA Signaling. Cell 172, 90–105.e23 (2018). [DOI] [PMC free article] [PubMed] [Google Scholar]
- 27.Banovich NE et al. Methylation QTLs are associated with coordinated changes in transcription factor binding, histone modifications, and gene expression levels. PLoS genetics 10, e1004663–e1004663 (2014). [DOI] [PMC free article] [PubMed] [Google Scholar]
- 28.Banovich NE et al. Impact of regulatory variation across human iPSCs and differentiated cells. Genome Research (2017). [DOI] [PMC free article] [PubMed]
- 29.Battle A et al. Impact of regulatory variation from RNA to protein. Science 347, 664–667 (2015). [DOI] [PMC free article] [PubMed] [Google Scholar]
- 30.Degner JF et al. DNase I sensitivity QTLs are a major determinant of human expression variation. Nature 482, 390 (2012). [DOI] [PMC free article] [PubMed] [Google Scholar]
- 31.Gate RE et al. Genetic determinants of co-accessible chromatin regions in activated T cells across humans. Nat Genet 50, 1140–1150 (2018). [DOI] [PMC free article] [PubMed] [Google Scholar]
- 32.Grubert F et al. Genetic Control of Chromatin States in Humans Involves Local and Distal Chromosomal Interactions. Cell 162, 1051–1065 (2015). [DOI] [PMC free article] [PubMed] [Google Scholar]
- 33.Pai AA et al. The Contribution of RNA Decay Quantitative Trait Loci to Inter-Individual Variation in Steady-State Gene Expression Levels. PLOS Genetics 8, e1003000 (2012). [DOI] [PMC free article] [PubMed] [Google Scholar]
- 34.Pai AA, Pritchard JK & Gilad Y The Genetic and Mechanistic Basis for Variation in Gene Regulation. PLOS Genetics 11, e1004857 (2015). [DOI] [PMC free article] [PubMed] [Google Scholar]
- 35.Chen L et al. Genetic Drivers of Epigenetic and Transcriptional Variation in Human Immune Cells. Cell 167, 1398–1414 e24 (2016). [DOI] [PMC free article] [PubMed] [Google Scholar]
- 36.Pickrell JK et al. Understanding mechanisms underlying human gene expression variation with RNA sequencing. Nature 464, 768 (2010). [DOI] [PMC free article] [PubMed] [Google Scholar]
- 37.Hormozdiari F et al. Leveraging molecular quantitative trait loci to understand the genetic architecture of diseases and complex traits. Nature Genetics 50, 1041–1047 (2018). [DOI] [PMC free article] [PubMed] [Google Scholar]
- 38.Lee MN et al. Common Genetic Variants Modulate Pathogen-Sensing Responses in Human Dendritic Cells. Science 343(2014). [DOI] [PMC free article] [PubMed] [Google Scholar]
- 39.Wen X, Lee Y, Luca F & Pique-Regi R Efficient Integrative Multi-SNP Association Analysis via Deterministic Approximation of Posteriors. The American Journal of Human Genetics 98, 1114–1129 (2016). [DOI] [PMC free article] [PubMed] [Google Scholar]
- 40.Wen X, Pique-Regi R & Luca F Integrating molecular QTL data into genome-wide genetic association analysis: Probabilistic assessment of enrichment and colocalization. PLOS Genetics 13, e1006646 (2017). [DOI] [PMC free article] [PubMed] [Google Scholar]
- 41.Finucane HK et al. Partitioning heritability by functional annotation using genome-wide association summary statistics. Nature Genetics 47, 1228 (2015). [DOI] [PMC free article] [PubMed] [Google Scholar]
- 42.Takata A, Matsumoto N & Kato T Genome-wide identification of splicing QTLs in the human brain and their enrichment among schizophrenia-associated loci. Nat Commun 8, 14519 (2017). [DOI] [PMC free article] [PubMed] [Google Scholar]
- 43.Li YI et al. RNA splicing is a primary link between genetic variation and disease. Science 352, 600–604 (2016). [DOI] [PMC free article] [PubMed] [Google Scholar]
- 44.Dominissini D et al. Topology of the human and mouse m6A RNA methylomes revealed by m6A-seq. Nature 485, 201 (2012). [DOI] [PubMed] [Google Scholar]
- 45.Meyer KD et al. Comprehensive analysis of mRNA methylation reveals enrichment in 3’ UTRs and near stop codons. Cell 149, 1635–1646 (2012). [DOI] [PMC free article] [PubMed] [Google Scholar]
- 46.Ongen H, Buil A, Brown AA, Dermitzakis ET & Delaneau O Fast and efficient QTL mapper for thousands of molecular phenotypes. Bioinformatics 32, 1479–1485 (2016). [DOI] [PMC free article] [PubMed] [Google Scholar]
- 47.Storey JD & Tibshirani R Statistical significance for genomewide studies. Proceedings of the National Academy of Sciences 100, 9440–9445 (2003). [DOI] [PMC free article] [PubMed] [Google Scholar]
- 48.Wang G, Sarkar AK, Carbonetto P & Stephens M A simple new approach to variable selection in regression, with application to genetic fine-mapping. bioRxiv, 501114 (2018). [DOI] [PMC free article] [PubMed] [Google Scholar]
- 49.Wen X Molecular QTL discovery incorporating genomic annotations using Bayesian false discovery rate control. Ann. Appl. Stat 10, 1619–1638 (2016). [Google Scholar]
- 50.Van Nostrand EL et al. Robust transcriptome-wide discovery of RNA-binding protein binding sites with enhanced CLIP (eCLIP). Nature Methods 13, 508 (2016). [DOI] [PMC free article] [PubMed] [Google Scholar]
- 51.Wan Y et al. Landscape and variation of RNA secondary structure across the human transcriptome. Nature 505, 706–709 (2014). [DOI] [PMC free article] [PubMed] [Google Scholar]
- 52.Agarwal V, Bell GW, Nam J-W & Bartel DP Predicting effective microRNA target sites in mammalian mRNAs. eLife 4, e05005 (2015). [DOI] [PMC free article] [PubMed] [Google Scholar]
- 53.Pers TH, Timshel P & Hirschhorn JN SNPsnap: a Web-based tool for identification and annotation of matched SNPs. Bioinformatics 31, 418–420 (2015). [DOI] [PMC free article] [PubMed] [Google Scholar]
- 54.Chen T et al. m6A RNA Methylation Is Regulated by MicroRNAs and Promotes Reprogramming to Pluripotency. Cell Stem Cell 16, 289–301 (2015). [DOI] [PubMed] [Google Scholar]
- 55.Das S & Krainer AR Emerging functions of SRSF1, splicing factor and oncoprotein, in RNA metabolism and cancer. Molecular cancer research : MCR 12, 1195–1204 (2014). [DOI] [PMC free article] [PubMed] [Google Scholar]
- 56.Bertero A et al. The SMAD2/3 interactome reveals that TGFbeta controls m(6)A mRNA methylation in pluripotency. Nature 555, 256–259 (2018). [DOI] [PMC free article] [PubMed] [Google Scholar]
- 57.Slobodin B et al. Transcription Impacts the Efficiency of mRNA Translation via Co-transcriptional N6-adenosine Methylation. Cell 169, 326–337 e12 (2017). [DOI] [PMC free article] [PubMed] [Google Scholar]
- 58.Aguilo F et al. Coordination of m6A mRNA Methylation and Gene Transcription by ZFP217 Regulates Pluripotency and Reprogramming. Cell Stem Cell 17, 689–704 (2015). [DOI] [PMC free article] [PubMed] [Google Scholar]
- 59.The EPC et al. An integrated encyclopedia of DNA elements in the human genome. Nature 489, 57 (2012). [DOI] [PMC free article] [PubMed] [Google Scholar]
- 60.Huang H et al. Histone H3 trimethylation at lysine 36 guides m6A RNA modification co-transcriptionally. Nature 567, 414–419 (2019). [DOI] [PMC free article] [PubMed] [Google Scholar]
- 61.Lee J et al. Effective breast cancer combination therapy targeting BACH1 and mitochondrial metabolism. Nature 568, 254–258 (2019). [DOI] [PMC free article] [PubMed] [Google Scholar]
- 62.Wiel C et al. BACH1 Stabilization by Antioxidants Stimulates Lung Cancer Metastasis. Cell 178, 330–345.e22 (2019). [DOI] [PubMed] [Google Scholar]
- 63.Gazal S et al. Linkage disequilibrium–dependent architecture of human complex traits shows action of negative selection. Nature Genetics 49, 1421–1427 (2017). [DOI] [PMC free article] [PubMed] [Google Scholar]
- 64.Bulik-Sullivan BK et al. LD Score regression distinguishes confounding from polygenicity in genome-wide association studies. Nature Genetics 47, 291 (2015). [DOI] [PMC free article] [PubMed] [Google Scholar]
- 65.Hansson GK Inflammation, atherosclerosis, and coronary artery disease. The New England journal of medicine 352, 1685–1695 (2005). [DOI] [PubMed] [Google Scholar]
- 66.Nath AP et al. Multivariate Genome-wide Association Analysis of a Cytokine Network Reveals Variants with Widespread Immune, Haematological, and Cardiometabolic Pleiotropy. American journal of human genetics 105, 1076–1090 (2019). [DOI] [PMC free article] [PubMed] [Google Scholar]
- 67.Stolk L et al. Meta-analyses identify 13 loci associated with age at menopause and highlight DNA repair and immune pathways. Nature Genetics 44, 260–268 (2012). [DOI] [PMC free article] [PubMed] [Google Scholar]
- 68.Li H-B et al. m6A mRNA methylation controls T cell homeostasis by targeting the IL-7/STAT5/SOCS pathways. Nature 548, 338 (2017). [DOI] [PMC free article] [PubMed] [Google Scholar]
- 69.Zheng Q, Hou J, Zhou Y, Li Z & Cao X The RNA helicase DDX46 inhibits innate immunity by entrapping m6A-demethylated antiviral transcripts in the nucleus. Nature Immunology 18, 1094 (2017). [DOI] [PubMed] [Google Scholar]
- 70.Lichinchi G et al. Dynamics of the human and viral m6A RNA methylomes during HIV-1 infection of T cells. Nature Microbiology 1, 16011 (2016). [DOI] [PMC free article] [PubMed] [Google Scholar]
- 71.Han D et al. Anti-tumour immunity controlled through mRNA m6A methylation and YTHDF1 in dendritic cells. Nature 566, 270–274 (2019). [DOI] [PMC free article] [PubMed] [Google Scholar]
- 72.Gusev A et al. Integrative approaches for large-scale transcriptome-wide association studies. Nature Genetics 48, 245–252 (2016). [DOI] [PMC free article] [PubMed] [Google Scholar]
- 73.Wainberg M et al. Opportunities and challenges for transcriptome-wide association studies. Nature Genetics 51, 592–599 (2019). [DOI] [PMC free article] [PubMed] [Google Scholar]
- 74.Giambartolomei C et al. Bayesian Test for Colocalisation between Pairs of Genetic Association Studies Using Summary Statistics. PLOS Genetics 10, e1004383 (2014). [DOI] [PMC free article] [PubMed] [Google Scholar]
- 75.Nakao K et al. Fusion of the Nucleoporin Gene, NUP98, and the Putative RNA Helicase Gene, DZXX10, by Inversion 11 (p15q22) Chromosome Translocation in a Patient with Etoposide-related Myelodysplastic Syndrome. Internal Medicine 39, 412–415 (2000). [DOI] [PubMed] [Google Scholar]
- 76.Snyder E et al. Compound Heterozygosity for Y Box Proteins Causes Sterility Due to Loss of Translational Repression. PLOS Genetics 11, e1005690 (2015). [DOI] [PMC free article] [PubMed] [Google Scholar]
- 77.Roy R et al. hnRNPA1 couples nuclear export and translation of specific mRNAs downstream of FGF-2/S6K2 signalling. Nucleic Acids Research 42, 12483–12497 (2014). [DOI] [PMC free article] [PubMed] [Google Scholar]
- 78.Liu N et al. N6-methyladenosine-dependent RNA structural switches regulate RNA–protein interactions. Nature 518, 560 (2015). [DOI] [PMC free article] [PubMed] [Google Scholar]
- 79.Manning KS & Cooper TA The roles of RNA processing in translating genotype to phenotype. Nature Reviews Molecular Cell Biology 18, 102–114 (2017). [DOI] [PMC free article] [PubMed] [Google Scholar]
- 80.Gurdasani D, Barroso I, Zeggini E & Sandhu MS Genomics of disease risk in globally diverse populations. Nature Reviews Genetics 20, 520–535 (2019). [DOI] [PubMed] [Google Scholar]
- 81.Shi H et al. Localizing components of shared transethnic genetic architecture of complex traits from GWAS summary data. bioRxiv, 858431 (2020). [DOI] [PMC free article] [PubMed] [Google Scholar]
- 82.Mogil LS et al. Genetic architecture of gene expression traits across diverse populations. PLOS Genetics 14, e1007586 (2018). [DOI] [PMC free article] [PubMed] [Google Scholar]
- 83.Ndungu A, Payne A, Torres JM, van de Bunt M & McCarthy MI A Multi-tissue Transcriptome Analysis of Human Metabolites Guides Interpretability of Associations Based on Multi-SNP Models for Gene Expression. The American Journal of Human Genetics 106, 188–201 (2020). [DOI] [PMC free article] [PubMed] [Google Scholar]
- 84.Schmiedel BJ et al. Impact of Genetic Polymorphisms on Human Immune Cell Gene Expression. Cell 175, 1701–1715.e16 (2018). [DOI] [PMC free article] [PubMed] [Google Scholar]
- 85.Calderon D et al. Landscape of stimulation-responsive chromatin across diverse human immune cells. Nature Genetics 51, 1494–1505 (2019). [DOI] [PMC free article] [PubMed] [Google Scholar]
- 86.Zhao BS et al. m(6)A-dependent maternal mRNA clearance facilitates zebrafish maternal-to-zygotic transition. Nature 542, 475–478 (2017). [DOI] [PMC free article] [PubMed] [Google Scholar]
Methods-only Reference
- 87.van de Geijn B, McVicker G, Gilad Y & Pritchard JK WASP: allele-specific software for robust molecular quantitative trait locus discovery. Nature methods 12, 1061–1063 (2015). [DOI] [PMC free article] [PubMed] [Google Scholar]
- 88.Heinz S et al. Simple Combinations of Lineage-Determining Transcription Factors Prime cis-Regulatory Elements Required for Macrophage and B Cell Identities. Molecular Cell 38, 576–589 (2010). [DOI] [PMC free article] [PubMed] [Google Scholar]
- 89.Cui X et al. Guitar: An R/Bioconductor Package for Gene Annotation Guided Transcriptomic Analysis of RNA-Related Genomic Features. BioMed research international 2016, 8367534–8367534 (2016). [DOI] [PMC free article] [PubMed] [Google Scholar]
- 90.The Genomes Project, C. et al. A global reference for human genetic variation. Nature 526, 68 (2015). [DOI] [PMC free article] [PubMed] [Google Scholar]
- 91.Howie B, Fuchsberger C, Stephens M, Marchini J & Abecasis GR Fast and accurate genotype imputation in genome-wide association studies through pre-phasing. Nature Genetics 44, 955 (2012). [DOI] [PMC free article] [PubMed] [Google Scholar]
- 92.Howie B, Marchini J & Stephens M Genotype Imputation with Thousands of Genomes. G3: Genes|Genomes|Genetics 1, 457 (2011). [DOI] [PMC free article] [PubMed] [Google Scholar]
- 93.Yu G, Wang L-G & He Q-Y ChIPseeker: an R/Bioconductor package for ChIP peak annotation, comparison and visualization. Bioinformatics 31, 2382–2383 (2015). [DOI] [PubMed] [Google Scholar]
- 94.Coetzee SG, Coetzee GA & Hazelett DJ motifbreakR: an R/Bioconductor package for predicting variant effects at transcription factor binding sites. Bioinformatics 31, 3847–3849 (2015). [DOI] [PMC free article] [PubMed] [Google Scholar]
- 95.Lappalainen T et al. Transcriptome and genome sequencing uncovers functional variation in humans. Nature 501, 506 (2013). [DOI] [PMC free article] [PubMed] [Google Scholar]
- 96.Dey KK, Xie D & Stephens M A new sequence logo plot to highlight enrichment and depletion. BMC Bioinformatics 19, 473 (2018). [DOI] [PMC free article] [PubMed] [Google Scholar]
- 97.Xia Z et al. Dynamic analyses of alternative polyadenylation from RNA-seq reveal a 3′-UTR landscape across seven tumour types. Nature Communications 5, 5274 (2014). [DOI] [PMC free article] [PubMed] [Google Scholar]
- 98.Sudlow C et al. UK Biobank: An Open Access Resource for Identifying the Causes of a Wide Range of Complex Diseases of Middle and Old Age. PLOS Medicine 12, e1001779 (2015). [DOI] [PMC free article] [PubMed] [Google Scholar]
- 99.Li YI et al. Annotation-free quantification of RNA splicing using LeafCutter. Nature Genetics 50, 151–158 (2018). [DOI] [PMC free article] [PubMed] [Google Scholar]
Associated Data
This section collects any data citations, data availability statements, or supplementary materials included in this article.
Supplementary Materials
Source Data Fig. 3 Raw Western Blots images.
Data Availability Statement
The m6A profiles of the 60 YRI samples generated in this study have been deposited in GEO repository: accession GSE125377. Raw data associated with Figure 3e is in the Supplementary Information.


