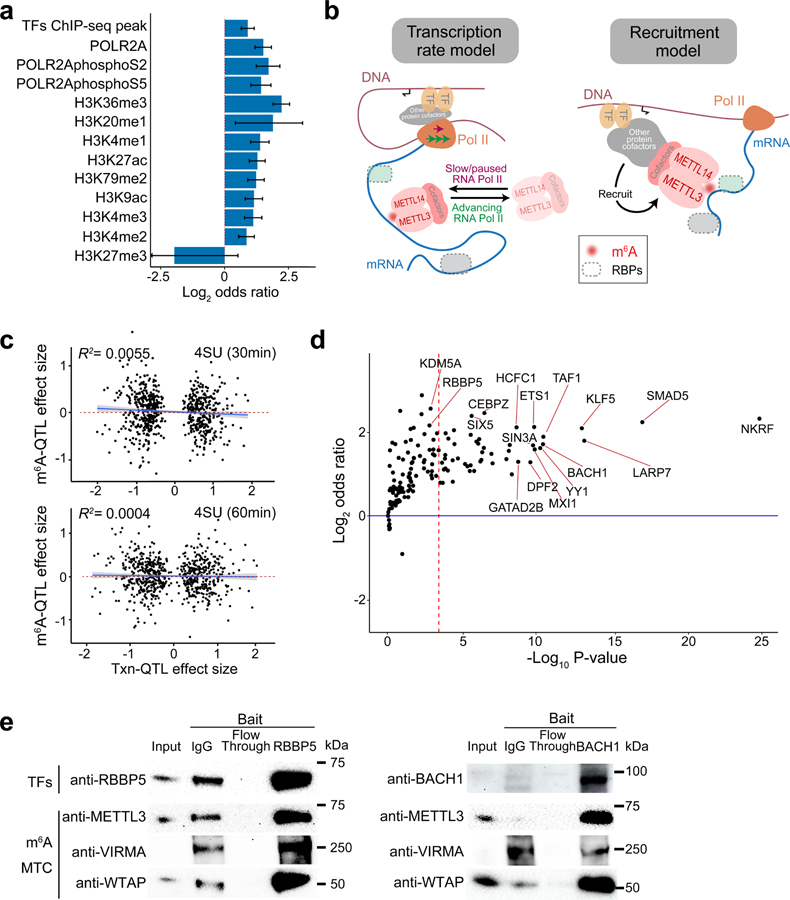
Fig. 3: m6A installation is coupled with transcriptional processes.
a, Enrichment of fine-mapped m6A-QTLs (SNP with the highest posterior inclusion probability, or PIP, in each credible set) in chromatin features by the two-sided Fisher’s exact test comparing m6A-QTLs to control SNPs. The error bars represent 95% confidence intervals. b, Two possible models of m6A regulation through transcription. c, Effect sizes of ascertained transcription rate QTLs (Txn-QTLs) vs. their effects on m6A level. The transcription rate was measured by 4sU-seq in an earlier study43. 4sU-seq of 30 mins 4sU labeling (upper, n = 698 SNPs) and 60 mins 4sU labeling (lower, n = 688 SNPs) showed similar results. Shaded region and line show the 95% confidence interval and fitted line from the linear model. d, Enrichment of m6A-QTL in transcription factor (TF) binding sites of individual TFs conditioned on H3K27ac peaks by Torus analysis. The red dashed line shows the Bonferroni-corrected P value 0.05 cutoff. e, Western blot of transcription factor (TF) co-IP experiment. 10% of lysate was loaded as “input”. The cropped blot of each TF of interest is shown, as well as three m6A methyltransferase complex components—METTL3, WTAP and VIRMA. These experiments were repeated twice with similar results.

