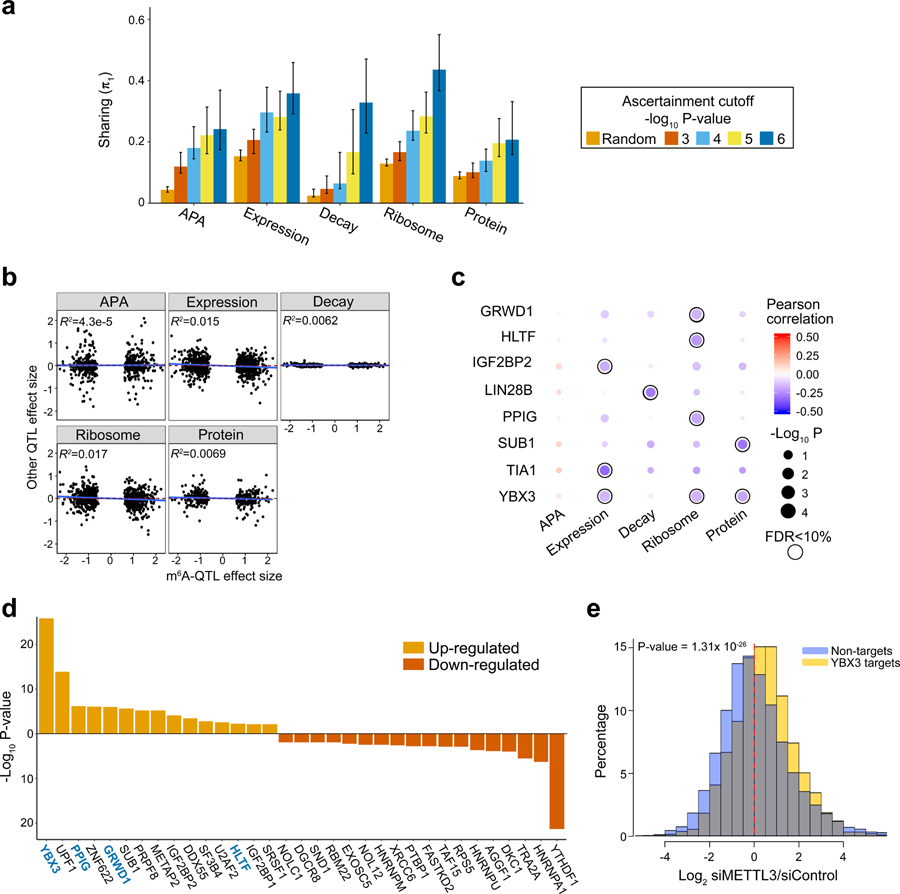
Fig. 4: Joint analysis of m6A-QTLs and other molecular QTLs.
a, The estimated fractions of m6A-QTLs shared with other molecular phenotypes, measured by π1, the fraction of true positives. The five bars in each panel correspond to random SNPs and m6A-QTLs at different P value cutoffs. Error bars show 80% confidence intervals (n = 100 bootstraps). b, Low correlations of effect sizes between m6A-QTLs and related molecular QTLs, estimated from linear regression (n = 709, 884, 742, 884 and 393 SNPs-gene pairs for APA, Expression, Decay, Ribosome and Protein, respectively). c, Correlations of effect sizes between m6A-QTLs and related molecular traits QTLs stratified by the m6A sites bound by different RBPs. Correlations are determined by linear regression. Shown are RBPs having at least one trait significantly correlated trait with m6A at FDR < 10%. Pearson correlations are shown by color code and P value by dot size. d, RNA binding proteins (RBPs) that modulate the impact of m6A depletion on translation efficiency. For each RBP, Welch’s two-sided t test is used to test the log2 fold-change in translation efficiency in RBP targets vs. non-targets, upon METTL3 knockdown (n = 11,412 transcripts). RBP targets are defined by transcripts harboring m6A peaks that are bound by certain RBP. Shown are RBPs with FDR < 5% (Benjamini & Hochberg method). RBPs with significant correlation between m6A-QTL and ribosome-QTL effect sizes are highlighted in blue. e, Distribution of log2 fold-change in translation efficiency of YBX3 targets, upon m6A (METTL3) depletion, in comparison with non-targets. P value is computed by Welch’s two-sided t test (n = 11,412 transcripts).

