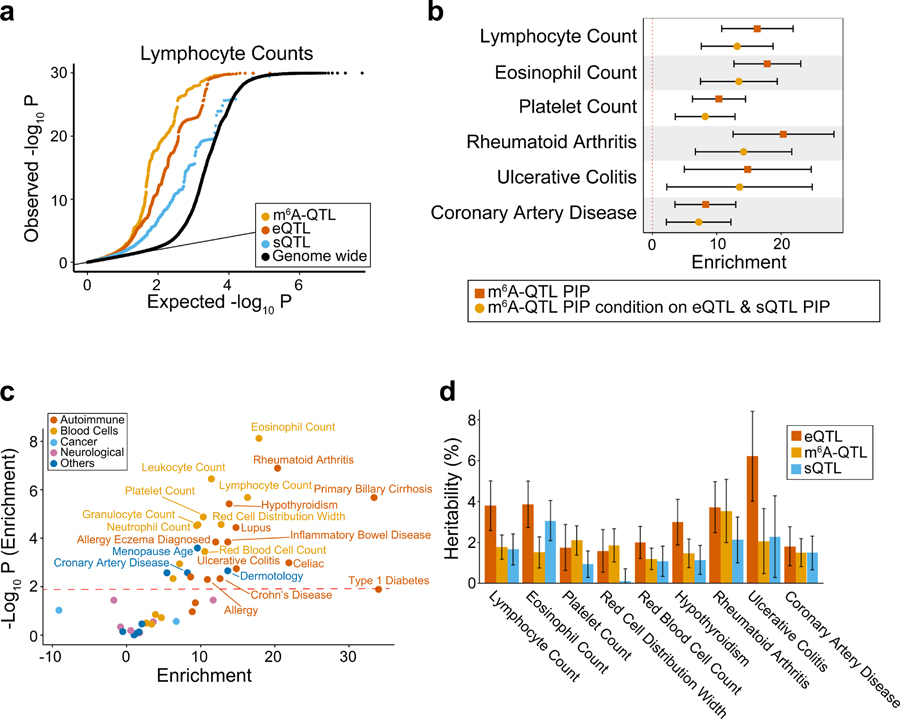
Fig. 5: Integrated analysis of m6A-QTLs and GWAS data of human complex traits.
a, Quantile-quantile (QQ) plot of lymphocyte count GWAS P values. m6A-QTLs, eQTLs and sQTLs are shown in comparison with genome wide SNPs. GWAS SNPs are binary annotated using m6A-QTLs, eQTLs and sQTLs with P value < 1 × 10⁻⁴. b, Enrichment of selected immune and blood GWAS trait heritability estimated by S-LDSC41,63,64. We used two QTL annotations: (1) m6A-QTL continuous annotation using PIP from fine-mapping (with uniform prior); (2) m6A-QTL PIP annotation conditional on eQTL and sQTL PIP annotations (with uniform prior). Error bars represent the 95% confidence intervals. c, Summary of GWAS trait heritability enrichment for all 45 traits using m6A-QTL PIP (with uniform priors) as annotation conditional on the baseline LD model. The dashed line shows the significance threshold at FDR 5%. d, Proportion of GWAS trait heritability explained by m6A-QTLs, eQTLs and sQTLs. Because it would be hard to estimate heritability contribution using PIP (continues annotation) from fine-mapping, we used binary annotations at SNP-level FDR 10% threshold in this analysis. Error bars represent standard errors.

