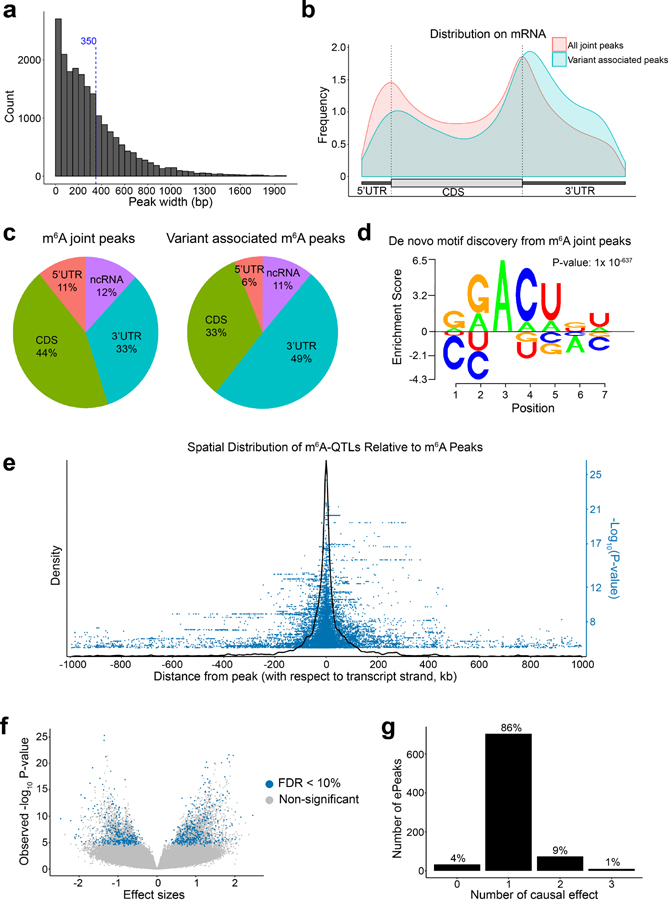
Extended Data Fig. 1. Joint m6A peak calling and QTL mapping.
a, Distribution of merged m6A peak length. Dash line marks the mean peak width. b, Distribution of all m6A peaks vs. ePeaks on a meta-gene. c, Proportion of all m6A peaks vs. ePeaks in each genomic annotation. d, m6A motif learned by Homer2, and visualized using EDlogo package. e, Spatial distribution of m6A-QTLs illustrated by density plot of SNP to peak distances of m6A-QTL with nominal P-value < 1X10⁻⁴ in a 2 Mb window surrounding m6A peaks. We also showed the significance by the -log10 P-value of the association tests in the blue dots. f, Volcano plot of overall statistics of m6A-QTLs with peak-level FDR < 10% (ePeaks). g, Distribution of the number of causal effects of ePeaks (FDR < 10%) by SuSiE fine-mapping with uniform prior. We set SuSiE parameters L = 3 (assuming at most three causal effects) and coverage = 0.95 (95% coverage for credible sets).

