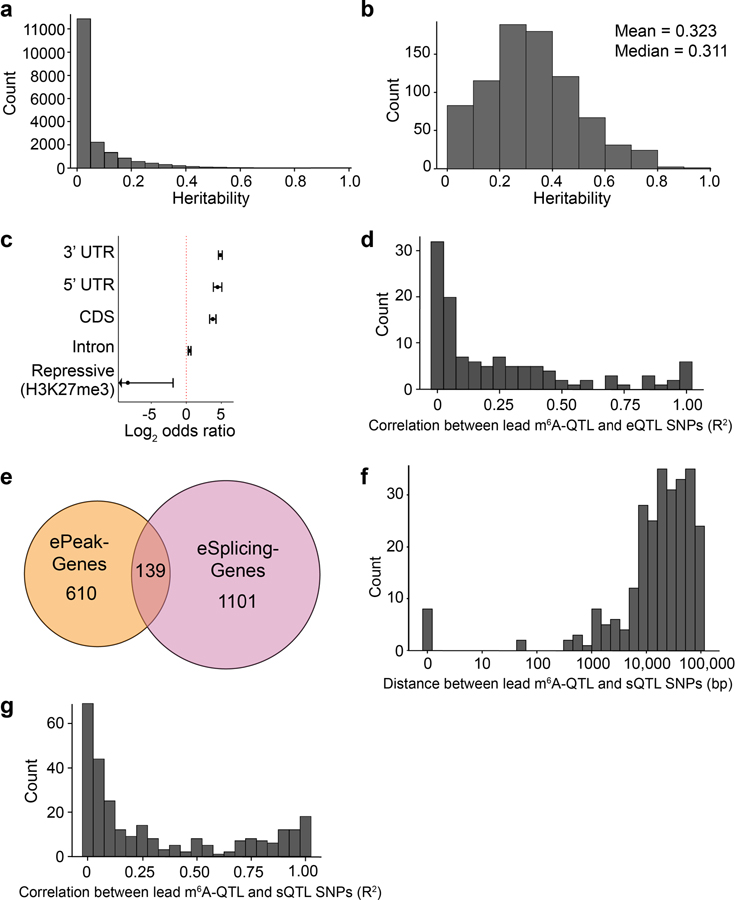
Extended Data Fig. 2. Heritability of m6A peaks and independence of m6A-QTLs, eQTL and sQTLs.
a, Distribution of estimated heritability of the 19,130 peaks included in the TWAS analysis, in which 918 peaks had estimated heritability significantly greater than 0 (minimum heritability P-value of 0.01). b, Distribution of estimated heritability of ePeaks (n = 822 peaks). c, Enrichment (log2 odds ratio) of m6A-QTLs in gene annotations. d, Distribution of the LD between the lead ePeak SNP and the eGene SNP in genes that have both ePeak and eGene mapped. e, Overlap between ePeak-harboring genes and eSplicing-harboring (splicing event with at least one significant sQTL) gene (both at FDR < 10%) mapped in YRI LCL samples. f, Distribution of the distance between the lead ePeak SNP and the eSplicing SNP in genes that have both ePeak and eSplicing mapped. g, Distribution of the LD between the lead ePeak SNP and eSplicing SNP in genes that have both ePeak and eSpicing mapped.

