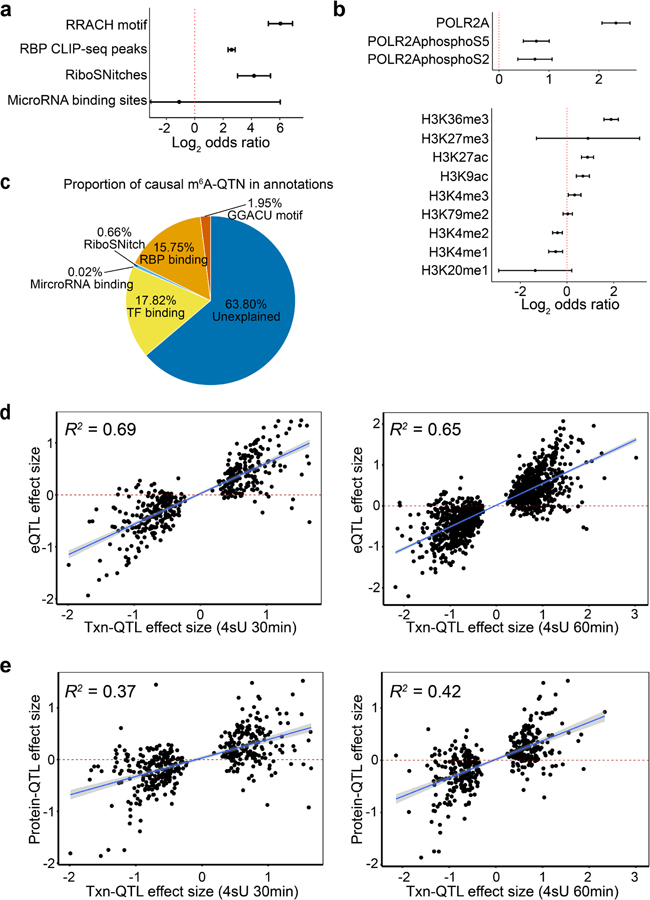
Extended Data Fig. 3. Contribution of RNA features and transcriptional features to m6A variation.
a, Enrichment of m6A-QTLs in RNA related features by Torus. Error bars represent the 95% confidence intervals. b, Enrichment of m6A-QTLs in the binding sites of RNA polymerase2 subunit A (POLR2A), and phosphorylated POLR2A at two residues (S2 and S5) by Torus joint analysis of all annotations (upper panel), and enrichment of m6A-QTLs in histone modifications from Torus joint analysis. Error bars indicate the 95% confidence intervals. c, Proportion of putative causal m6A-QTNs in RNA features and transcription factor binding site annotations (see Methods). d-e, To confirm that transcription rate affects mRNA and protein level, we ascertained transcription rate QTLs (Txn-QTLs) and assessed the correlation between transcription rate (Txn)-QTL effect sizes (30 min and 60 min 4sU labelling, respectively) and eQTL effect size (panel d, n = 425 and 1,387 SNP-gene pairs), and protein-QTL effect sizes (panel e, n = 425 and 408 SNP-gene pairs). Correlation is computed using linear regression. Fitted lines and 95% confidence intervals are shown in blue lines and shades.

