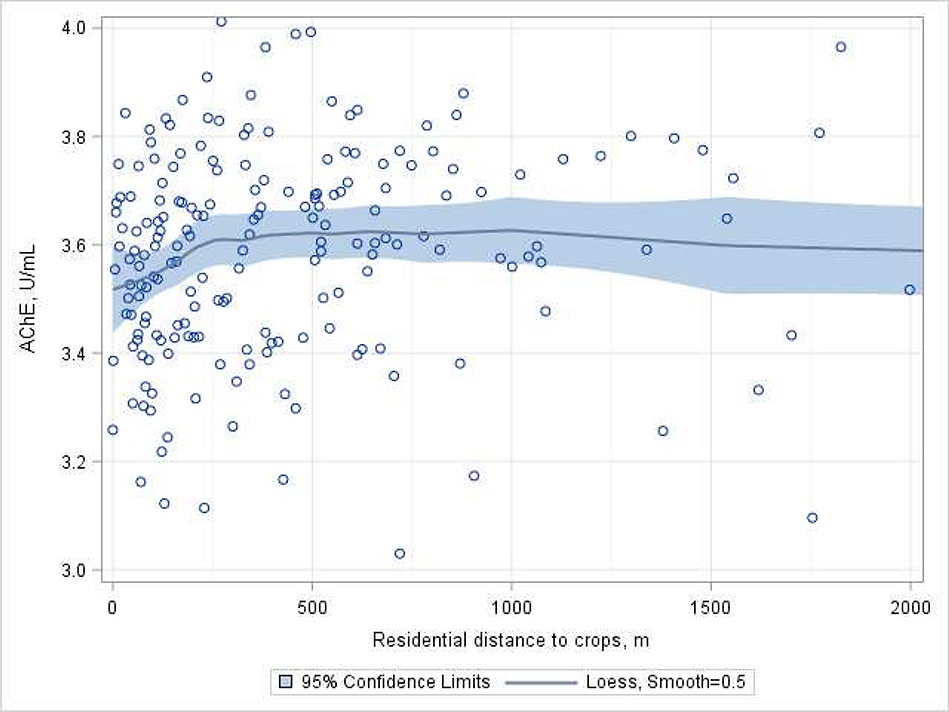
Figure 2.
Associations between residential distance to the nearest flower crop and AChE activity among children (N=621, Nobs= 1149). Data points for children living at >2000m from a crop are not displayed.
Circles represent the least squared means (based on repeated-measures GEE) of AChE activity for 200 quantiles of distance, adjusted for age, gender, parental education, height-for-age z-score, hemoglobin concentration, examination year, cohabitation with a floricultural worker, pesticide use within the residential property, neighbor use of pesticides on their property lot and examination date (days after a peak exposure period). The line represents the adjusted slope of the association (LOESS) based on the adjusted least squared means, and blue areas represent the 95% CI.

