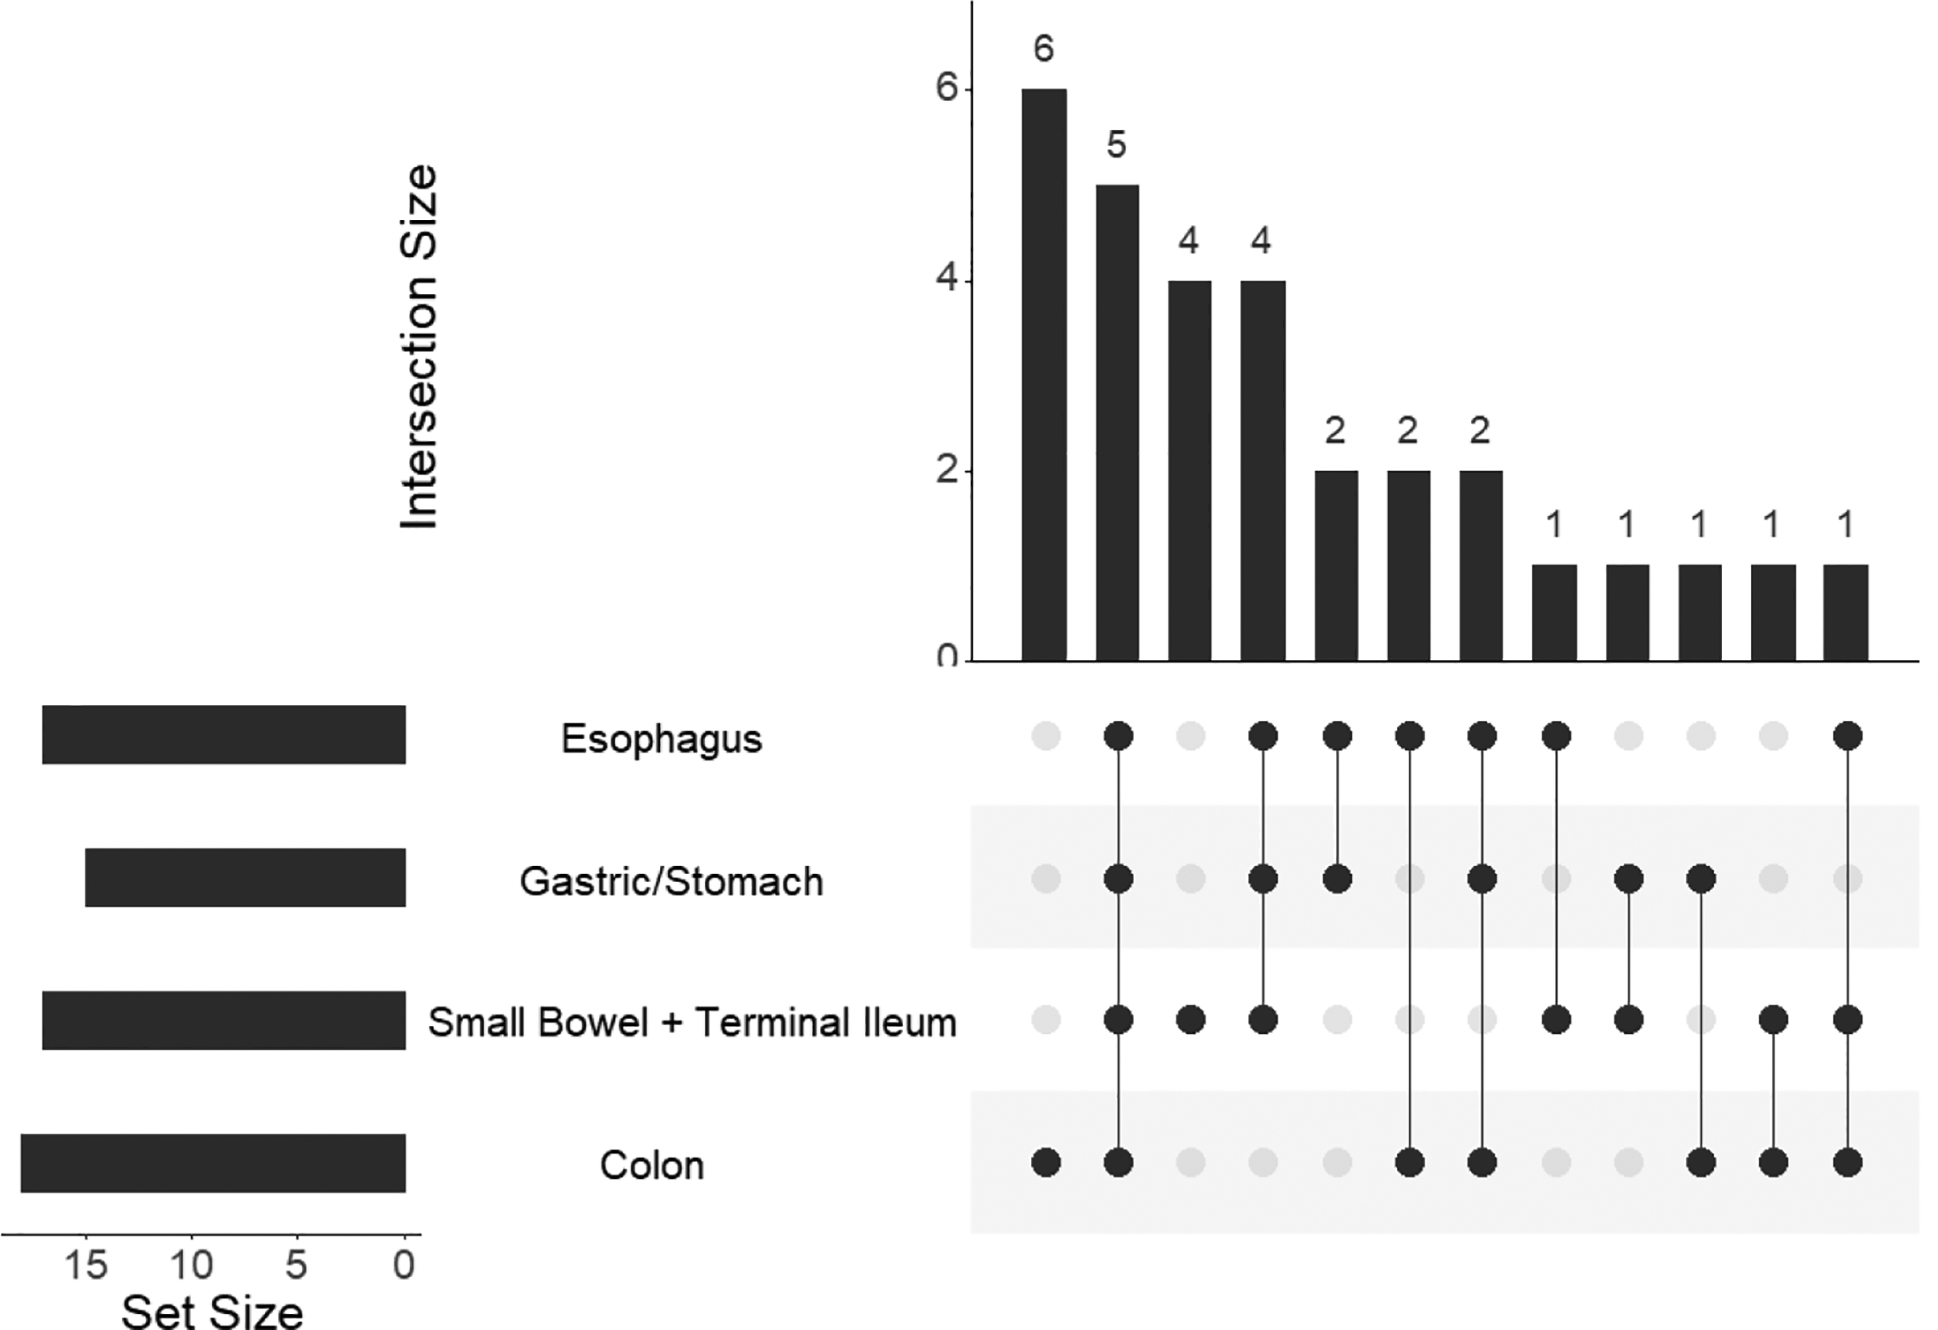
Figure 2A.

This graph represents the subset of patients who underwent biopsies in all four indicated anatomic regions (n=30). Horizontal bars indicate numbers of patients who had a biopsy meeting the eosinophil inclusion cutoff in the indicated anatomic region. Vertical bars and the numbers atop indicate patients who had a biopsy in the indicated combinations of anatomic regions meeting inclusion criteria. Black dots indicate anatomic region that met criteria for eosinophilia and combinations are connected by lines. Patients in the various groups are mutually exclusive.
